Overview
This document summarizes clinical data for Iptacopan (FABHALTA) , an oral complement inhibitor for treating Paroxysmal Nocturnal Hemoglobinuria (PNH).
Clinical Trial Overview
Code
# Create trial overview data frame <- data.frame (Trial = c ("APPLY-PNH" , "APPOINT-PNH" , "APPULSE-PNH" ),NCT_Number = c ("NCT04558918" , "NCT04820530" , "NCT05630001" ),Design = c ("Phase 3, Active-controlled" , "Phase 3, Single-arm" , "Phase 3b, Single-arm" ),Population = c ("Anti-C5 experienced with Hb <10 g/dL" , "Complement inhibitor-naive with Hb <10 g/dL" ,"Anti-C5 treated with Hb ≥10 g/dL" ),N = c (97 , 40 , 52 ),Primary_Endpoint = c ("Hb increase ≥2 g/dL & Hb ≥12 g/dL" ,"Hb increase ≥2 g/dL" ,"Mean Hb change from baseline" ),Duration = c ("24 weeks (48 weeks extension)" , "24 weeks (48 weeks extension)" ,"24 weeks" ),stringsAsFactors = FALSE %>% kable (caption = "Summary of Iptacopan Clinical Trials" ) %>% kable_styling (bootstrap_options = c ("striped" , "hover" , "condensed" ))
Summary of Iptacopan Clinical Trials
APPLY-PNH
NCT04558918
Phase 3, Active-controlled
Anti-C5 experienced with Hb <10 g/dL
97
Hb increase ≥2 g/dL & Hb ≥12 g/dL
24 weeks (48 weeks extension)
APPOINT-PNH
NCT04820530
Phase 3, Single-arm
Complement inhibitor-naive with Hb <10 g/dL
40
Hb increase ≥2 g/dL
24 weeks (48 weeks extension)
APPULSE-PNH
NCT05630001
Phase 3b, Single-arm
Anti-C5 treated with Hb ≥10 g/dL
52
Mean Hb change from baseline
24 weeks
APPLY-PNH Trial Results
Patient Demographics
Code
# APPLY-PNH baseline demographics <- data.frame (Characteristic = c ("N" , "Mean age (years)" , "Female (%)" , "Mean disease duration (years)" ,"Received ≥1 RBC transfusion in prior 6 months (%)" ,"Mean baseline Hb (g/dL)" , "Mean baseline LDH (U/L)" ),Iptacopan = c ("62" , "51.7 (16.9)" , "69.4" , "11.9 (9.8)" , "56.5" , "8.9 (0.7)" , "269.1 (70.1)" ),` Anti-C5 ` = c ("35" , "49.8 (16.7)" , "68.6" , "13.6 (10.9)" , "60.0" , "8.9 (0.9)" , "272.7 (84.8)" )%>% kable (caption = "APPLY-PNH Baseline Demographics (Mean (SD))" ) %>% kable_styling (bootstrap_options = c ("striped" , "hover" ))
APPLY-PNH Baseline Demographics (Mean (SD))
N
62
35
Mean age (years)
51.7 (16.9)
49.8 (16.7)
Female (%)
69.4
68.6
Mean disease duration (years)
11.9 (9.8)
13.6 (10.9)
Received ≥1 RBC transfusion in prior 6 months (%)
56.5
60.0
Mean baseline Hb (g/dL)
8.9 (0.7)
8.9 (0.9)
Mean baseline LDH (U/L)
269.1 (70.1)
272.7 (84.8)
Primary Efficacy Results (24 weeks)
Code
# APPLY-PNH 24-week efficacy results <- data.frame (Endpoint = c ("Hb increase ≥2 g/dL (%)" , "Hb ≥12 g/dL (%)" ,"Transfusion avoidance (%)" ,"Mean Hb change from baseline (g/dL)" ,"Mean ARC change from baseline (10⁹/L)" ,"Mean FACIT-Fatigue score change" ),Iptacopan_n62 = c ("82.3" , "67.7" , "95.2" , "3.6" , "-116" , "8.62" ),AntiC5_n35 = c ("0" , "0" , "45.7" , "-0.1" , "0" , "0.28" ),P_value = c ("<0.0001" , "<0.0001" , "<0.0001" , "<0.0001" , "<0.0001" , "-" )%>% kable (caption = "APPLY-PNH Primary Efficacy Results at 24 Weeks" ) %>% kable_styling (bootstrap_options = c ("striped" , "hover" )) %>% column_spec (4 , bold = TRUE , color = "darkgreen" )
APPLY-PNH Primary Efficacy Results at 24 Weeks
Hb increase ≥2 g/dL (%)
82.3
0
<0.0001
Hb ≥12 g/dL (%)
67.7
0
<0.0001
Transfusion avoidance (%)
95.2
45.7
<0.0001
Mean Hb change from baseline (g/dL)
3.6
-0.1
<0.0001
Mean ARC change from baseline (10⁹/L)
-116
0
<0.0001
Mean FACIT-Fatigue score change
8.62
0.28
-
APPOINT-PNH Trial Results
Patient Demographics
Code
# APPOINT-PNH baseline demographics <- data.frame (Characteristic = c ("N" , "Mean age (years)" , "Female (%)" , "Mean disease duration (years)" ,"Required RBC transfusion in prior 6 months (%)" ,"Mean baseline Hb (g/dL)" , "Mean baseline LDH (U/L)" ,"Mean baseline ARC (×10⁹/L)" ),Value = c ("40" , "42.1" , "42.5" , "4.7" , "70" , "8.2" , "1699" , "154" )%>% kable (caption = "APPOINT-PNH Baseline Demographics" , col.names = c ("Characteristic" , "Iptacopan (N=40)" )) %>% kable_styling (bootstrap_options = c ("striped" , "hover" ))
APPOINT-PNH Baseline Demographics
N
40
Mean age (years)
42.1
Female (%)
42.5
Mean disease duration (years)
4.7
Required RBC transfusion in prior 6 months (%)
70
Mean baseline Hb (g/dL)
8.2
Mean baseline LDH (U/L)
1699
Mean baseline ARC (×10⁹/L)
154
Primary Efficacy Results (24 Weeks)
Code
# APPOINT-PNH 24-week efficacy results <- data.frame (Endpoint = c ("Hb increase ≥2 g/dL (%, 95% CI)" ,"Hb ≥12 g/dL (%, 95% CI)" ,"Transfusion avoidance (%, 95% CI)" ,"Mean Hb change from baseline (g/dL, 95% CI)" ,"Mean ARC change from baseline (10⁹/L, 95% CI)" ,"Mean LDH change from baseline (%)" ,"Mean FACIT-Fatigue score change (95% CI)" ),Result = c ("77.5 (61.5, 89.2)" ,"47.5 (31.5, 63.9)" ,"100 (91.2, 100)" ,"4.29 (3.86, 4.72)" ,"-80.75 (-87.78, -73.71)" ,"-83.5 (-84.9, -82.0)" ,"10.79 (8.63, 12.95)" )%>% kable (caption = "APPOINT-PNH Primary Efficacy Results at 24 Weeks" ) %>% kable_styling (bootstrap_options = c ("striped" , "hover" ))
APPOINT-PNH Primary Efficacy Results at 24 Weeks
Hb increase ≥2 g/dL (%, 95% CI)
77.5 (61.5, 89.2)
Hb ≥12 g/dL (%, 95% CI)
47.5 (31.5, 63.9)
Transfusion avoidance (%, 95% CI)
100 (91.2, 100)
Mean Hb change from baseline (g/dL, 95% CI)
4.29 (3.86, 4.72)
Mean ARC change from baseline (10⁹/L, 95% CI)
-80.75 (-87.78, -73.71)
Mean LDH change from baseline (%)
-83.5 (-84.9, -82.0)
Mean FACIT-Fatigue score change (95% CI)
10.79 (8.63, 12.95)
APPULSE-PNH Trial Results
Study Design and Population
Code
# APPULSE-PNH study characteristics <- data.frame (Characteristic = c ("Study Design" , "N" , "Population" , "Prior Anti-C5 Treatment" ,"Mean baseline Hb (g/dL)" ,"Mean baseline LDH (U/L)" ,"Primary Endpoint" ),Value = c ("Phase 3b, single-arm, open-label" ,"52" ,"PNH patients with Hb ≥10 g/dL on stable anti-C5" ,"Ravulizumab (88.5%), Eculizumab (11.5%)" ,"11.87 (1.32)" ,"226.8 (69.1)" ,"Mean Hb change from baseline (non-inferiority margin: -1 g/dL)" )%>% kable (caption = "APPULSE-PNH Study Characteristics" ) %>% kable_styling (bootstrap_options = c ("striped" , "hover" ))
APPULSE-PNH Study Characteristics
Study Design
Phase 3b, single-arm, open-label
N
52
Population
PNH patients with Hb ≥10 g/dL on stable anti-C5
Prior Anti-C5 Treatment
Ravulizumab (88.5%), Eculizumab (11.5%)
Mean baseline Hb (g/dL)
11.87 (1.32)
Mean baseline LDH (U/L)
226.8 (69.1)
Primary Endpoint
Mean Hb change from baseline (non-inferiority margin: -1 g/dL)
Primary Results
Code
# APPULSE-PNH results <- data.frame (Population = c ("All patients" , "Baseline Hb <12 g/dL" , "Baseline Hb ≥12 g/dL" ),N = c (52 , 32 , 20 ),` Mean_Hb_Change_gDL ` = c ("+2.01 (1.74, 2.29)" , "+2.37 (2.01, 2.74)" , "+1.44 (1.04, 1.84)" ),` Achieved_Hb_12_Percent ` = c ("92.7%" , "-" , "-" ),` Transfusion_Avoidance_Percent ` = c ("100%" , "-" , "-" )%>% kable (caption = "APPULSE-PNH Key Results (95% CI)" ,col.names = c ("Population" , "N" , "Mean Hb Change (g/dL)" , "Achieved Hb ≥12 g/dL" , "Transfusion Avoidance" )) %>% kable_styling (bootstrap_options = c ("striped" , "hover" ))
APPULSE-PNH Key Results (95% CI)
All patients
52
+2.01 (1.74, 2.29)
92.7%
100%
Baseline Hb <12 g/dL
32
+2.37 (2.01, 2.74)
-
-
Baseline Hb ≥12 g/dL
20
+1.44 (1.04, 1.84)
-
-
Safety Summary
Common Adverse Events (≥10% Incidence)
Code
# Create safety summary table <- data.frame (Adverse_Event = c ("Headache" , "Nasopharyngitis" , "Diarrhea" , "Abdominal pain" , "Bacterial infection" ,"Nausea" , "Viral infection" , "Rash" ),APPLY_PNH = c ("19%" , "16%" , "15%" , "15%" , "11%" , "10%" , "10%" , "3%" ),APPOINT_PNH = c ("28%" , "15%" , "8%" , "8%" , "5%" , "5%" , "18%" , "10%" ),APPULSE_PNH = c ("17.3%" , "11.5%" , "11.5%" , "-" , "-" , "11.5%" , "-" , "-" )%>% kable (caption = "Common Adverse Events Across Trials" ) %>% kable_styling (bootstrap_options = c ("striped" , "hover" ))
Common Adverse Events Across Trials
Headache
19%
28%
17.3%
Nasopharyngitis
16%
15%
11.5%
Diarrhea
15%
8%
11.5%
Abdominal pain
15%
8%
-
Bacterial infection
11%
5%
-
Nausea
10%
5%
11.5%
Viral infection
10%
18%
-
Rash
3%
10%
-
Serious Safety Considerations
Code
# Serious safety events <- data.frame (Category = c ("Serious Infections (Encapsulated Bacteria)" ,"Breakthrough Hemolysis" ,"MAVEs (Major Adverse Vascular Events)" ,"Treatment Discontinuation" ,"Deaths" ),Notes = c ("Boxed warning; requires vaccination 2 weeks prior to treatment" ,"Low incidence across trials (0-0.11 events/year)" ,"Low incidence across trials (0-0.04 events/year)" ,"Low rates (generally <5%)" ,"No drug-related deaths reported" )%>% kable (caption = "Serious Safety Considerations" ) %>% kable_styling (bootstrap_options = c ("striped" , "hover" ))
Serious Safety Considerations
Serious Infections (Encapsulated Bacteria)
Boxed warning; requires vaccination 2 weeks prior to treatment
Breakthrough Hemolysis
Low incidence across trials (0-0.11 events/year)
MAVEs (Major Adverse Vascular Events)
Low incidence across trials (0-0.04 events/year)
Treatment Discontinuation
Low rates (generally <5%)
Deaths
No drug-related deaths reported
Long-Term Extension Data (2-Year Follow-up)
Code
# 2-year extension data <- data.frame (Endpoint = c ("Patients continuing treatment at 2 years" ,"Sustained Hb ≥12 g/dL (without transfusion)" ,"Hb increase ≥2 g/dL (without transfusion)" ,"Transfusion independence" ,"Mean Hb at 2 years (g/dL)" ,"LDH <1.5×ULN" ),Combined_Results = c ("94.1% (128/136)" ,"71.0% (88/124)" ,"81.5% (101/124)" ,"90.4%" ,"12.69 (2.02)" ,"88.7% (110/124)" )%>% kable (caption = "2-Year Extension Study Results (Combined APPLY + APPOINT)" ) %>% kable_styling (bootstrap_options = c ("striped" , "hover" ))
2-Year Extension Study Results (Combined APPLY + APPOINT)
Patients continuing treatment at 2 years
94.1% (128/136)
Sustained Hb ≥12 g/dL (without transfusion)
71.0% (88/124)
Hb increase ≥2 g/dL (without transfusion)
81.5% (101/124)
Transfusion independence
90.4%
Mean Hb at 2 years (g/dL)
12.69 (2.02)
LDH <1.5×ULN
88.7% (110/124)
Comparative Efficacy Visulization
Code
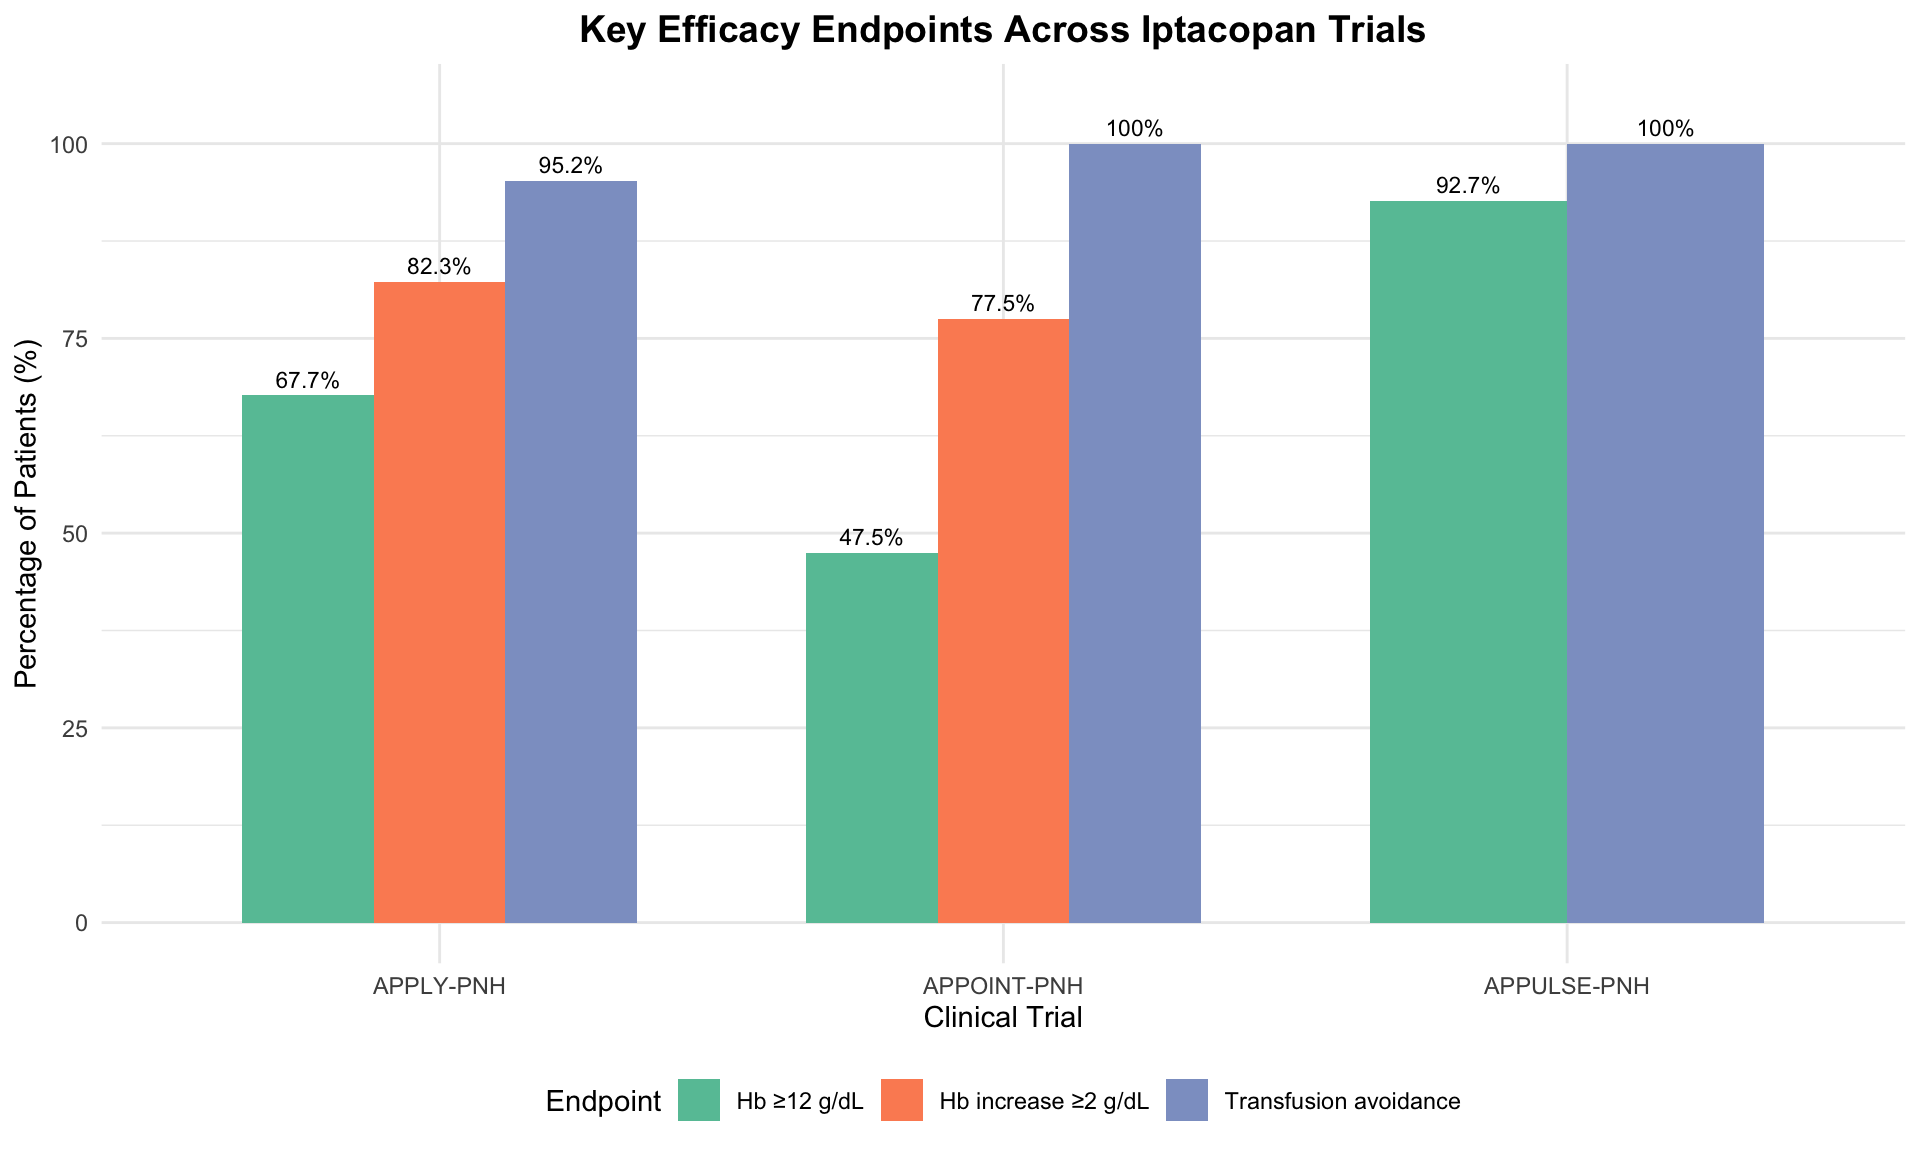
# Create comparative efficacy data for visualization <- data.frame (Trial = rep (c ("APPLY-PNH" , "APPOINT-PNH" , "APPULSE-PNH" ), each = 3 ),Endpoint = rep (c ("Hb increase ≥2 g/dL" , "Hb ≥12 g/dL" , "Transfusion avoidance" ), 3 ),Percentage = c (82.3 , 67.7 , 95.2 , # APPLY 77.5 , 47.5 , 100 , # APPOINT NA , 92.7 , 100 ) # APPULSE (NA for Hb increase metric) # Create grouped bar plot <- ggplot (efficacy_comparison %>% filter (! is.na (Percentage)), aes (x = Trial, y = Percentage, fill = Endpoint)) + geom_bar (stat = "identity" , position = "dodge" , width = 0.7 ) + scale_fill_brewer (palette = "Set2" ) + labs (title = "Key Efficacy Endpoints Across Iptacopan Trials" ,x = "Clinical Trial" ,y = "Percentage of Patients (%)" ,fill = "Endpoint" ) + theme_minimal () + theme (legend.position = "bottom" ,plot.title = element_text (hjust = 0.5 , size = 14 , face = "bold" )) + ylim (0 , 105 ) + geom_text (aes (label = paste0 (round (Percentage, 1 ), "%" )), position = position_dodge (width = 0.7 ), vjust = - 0.5 , size = 3 )print (p)
Real-World Evidence
Cleveland Clinic Experience (N=43)
Code
# Real-world Cleveland Clinic data <- data.frame (Category = c ("Total Patients" , "CI-naive" , "CI-experienced (switched)" ,"Suboptimal responders" ),N = c (43 , 8 , 35 , 25 ),Mean_Hb_Baseline = c ("-" , "11.9" , "10.3" , "10.3" ),Mean_Hb_3months = c ("-" , "12.3" , "11.6" , "11.6" ),P_value = c ("-" , "-" , "0.006" , "0.006" )%>% kable (caption = "Real-World Experience: Cleveland Clinic" ,col.names = c ("Category" , "N" , "Baseline Hb (g/dL)" , "3-Month Hb (g/dL)" , "P-value" )) %>% kable_styling (bootstrap_options = c ("striped" , "hover" ))
Real-World Experience: Cleveland Clinic
Total Patients
43
-
-
-
CI-naive
8
11.9
12.3
-
CI-experienced (switched)
35
10.3
11.6
0.006
Suboptimal responders
25
10.3
11.6
0.006
Key Clinical Takeaways
Code
<- list ("Efficacy" = c ("Significant Hb improvements across all patient populations" ,"High transfusion avoidance rates (>90% in all trials)" ,"Sustained efficacy at 2 years with 71% maintaining Hb ≥12 g/dL" ,"Effective in both CI-naive and CI-experienced patients" "Safety" = c ("Generally well-tolerated with mostly mild/moderate AEs" ,"Low rates of breakthrough hemolysis and MAVEs" ,"Requires vaccination against encapsulated bacteria (boxed warning)" ,"No new safety signals identified in long-term follow-up" "Practical Advantages" = c ("Oral administration (200 mg twice daily)" ,"No need for IV infusions" ,"Comprehensive hemolysis control (both IVH and EVH)" ,"Effective alternative for suboptimal responders to anti-C5 therapy" # Display as formatted lists for (category in names (key_takeaways)) {cat ("##" , category, " \n\n " )for (point in key_takeaways[[category]]) {cat ("- " , point, " \n " )cat (" \n " )
## Efficacy

-  Significant Hb improvements across all patient populations
-  High transfusion avoidance rates (>90% in all trials)
-  Sustained efficacy at 2 years with 71% maintaining Hb ≥12 g/dL
-  Effective in both CI-naive and CI-experienced patients

## Safety

-  Generally well-tolerated with mostly mild/moderate AEs
-  Low rates of breakthrough hemolysis and MAVEs
-  Requires vaccination against encapsulated bacteria (boxed warning)
-  No new safety signals identified in long-term follow-up

## Practical Advantages

-  Oral administration (200 mg twice daily)
-  No need for IV infusions
-  Comprehensive hemolysis control (both IVH and EVH)
-  Effective alternative for suboptimal responders to anti-C5 therapy
Statistical Summary Functions
Code
# Function to calculate response rates with confidence intervals <- function (responders, total, conf_level = 0.95 ) {<- prop.test (responders, total, conf.level = conf_level)return (list (rate = responders/ total * 100 ,lower_ci = prop_test$ conf.int[1 ] * 100 ,upper_ci = prop_test$ conf.int[2 ] * 100 ,formatted = sprintf ("%.1f%% (%.1f, %.1f)" , / total * 100 ,$ conf.int[1 ] * 100 ,$ conf.int[2 ] * 100 )# Example usage with APPLY-PNH data <- calculate_response_rate (51 , 62 )cat ("APPLY-PNH Hb ≥2 g/dL increase rate:" , apply_hb_response$ formatted, " \n " )
APPLY-PNH Hb ≥2 g/dL increase rate: 82.3% (70.1, 90.4)
Code
# Function to compare treatment groups <- function (group1_responders, group1_total, # Chi-square test <- matrix (c (group1_responders, group1_total - group1_responders,- group2_responders),nrow = 2 , byrow = TRUE )<- chisq.test (cont_table)return (list (group1_rate = group1_responders/ group1_total * 100 ,group2_rate = group2_responders/ group2_total * 100 ,p_value = chi_test$ p.value,significant = chi_test$ p.value < 0.05 # Example comparison <- compare_treatments (51 , 62 , 0 , 35 ) # APPLY-PNH iptacopan vs anti-C5 cat (" \n Treatment comparison p-value:" , format.pval (comparison$ p_value), " \n " )
Treatment comparison p-value: 3.4567e-14