2  PHIP

Published

August 19, 2026

2.1 Introduction

This analysis examines PHIP (Pleckstrin Homology Domain Interacting Protein) mutations in acute myeloid leukemia (AML) patients, with a focus on ancestry-associated differences.

It was published in Nature Genetics Stiff et al. (2024)

2.2 Mechanism of PHIP

Oncogenic function of PHIP Kain et al. (2024)

2.3 Data Setup

Code
# Create mutation frequency data
mutation_freq <- data.frame(
  Population = c("Black (Alliance)", "White (BeatAML)", "Nigerian", "South African"),
  Total_Patients = c(100, 323, 46, 23),
  PHIP_Mutated = c(7, 1, 3, 0),
  stringsAsFactors = FALSE
) %>%
  mutate(
    Mutation_Rate = PHIP_Mutated / Total_Patients * 100,
    Not_Mutated = Total_Patients - PHIP_Mutated
  )

# Create detailed mutation data
phip_mutations <- data.frame(
  Mutation = c("H250P", "S272P", "Q135_136delA", "Y1272C", "T1316*", 
               "H1808*", "c.2320-2A>T", "c.3122+1_3122+2insC", 
               "c.3318-46_3318-3del", "c.3657-4dupT"),
  Type = c("Missense", "Missense", "Deletion", "Missense", "Nonsense",
           "Nonsense", "Splice site", "Splice site", "Splice site", "Splice site"),
  Position = c(250, 272, 135, 1272, 1316, 1808, NA, NA, NA, NA),
  Protein_Domain = c("N-terminal", "N-terminal", "N-terminal", "Central", 
                     "Central", "C-terminal", NA, NA, NA, NA)
)

# Nigerian patient data
nigerian_patients <- data.frame(
  Patient_ID = paste0("NG_", 1:3),
  Age = c(5, 31, 42),
  Sex = c("Male", "Male", "Female"),
  PHIP_Status = "Mutated"
)

# Comparison with other genes (simulated data for context)
gene_comparison <- data.frame(
  Gene = c("FLT3", "DNMT3A", "NRAS", "NPM1", "IDH2", "RUNX1", "KRAS", 
           "ASXL1", "WT1", "IDH1", "PHIP", "TET2", "TP53"),
  Black_Freq = c(32, 25, 23, 20, 11, 10, 9, 8, 8, 7, 7, 7, 7),
  White_Freq = c(28, 30, 18, 25, 12, 8, 6, 10, 5, 9, 0.3, 15, 12)
) %>%
  pivot_longer(cols = c(Black_Freq, White_Freq), 
               names_to = "Population", 
               values_to = "Frequency") %>%
  mutate(Population = str_replace(Population, "_Freq", ""))
2.4 Mutation Frequency Analysis

2.4.1 Summary Table

Code
mutation_freq %>%
  select(Population, Total_Patients, PHIP_Mutated, Mutation_Rate) %>%
  kable(
    col.names = c("Population", "Total Patients", "PHIP Mutations", "Mutation Rate (%)"),
    digits = 2,
    caption = "PHIP mutation frequency across populations"
  ) %>%
  kable_styling(
    bootstrap_options = c("striped", "hover", "condensed"),
    full_width = FALSE,
    position = "center"
  ) %>%
  row_spec(1:2, bold = TRUE, background = "#f0f0f0") %>%
  footnote(general = "P < 0.001 for Black vs White comparison (Fisher's exact test)")
PHIP mutation frequency across populations
Population Total Patients PHIP Mutations Mutation Rate (%)
Black (Alliance) 100 7 7.00
White (BeatAML) 323 1 0.31
Nigerian 46 3 6.52
South African 23 0 0.00
Note:
P < 0.001 for Black vs White comparison (Fisher's exact test)

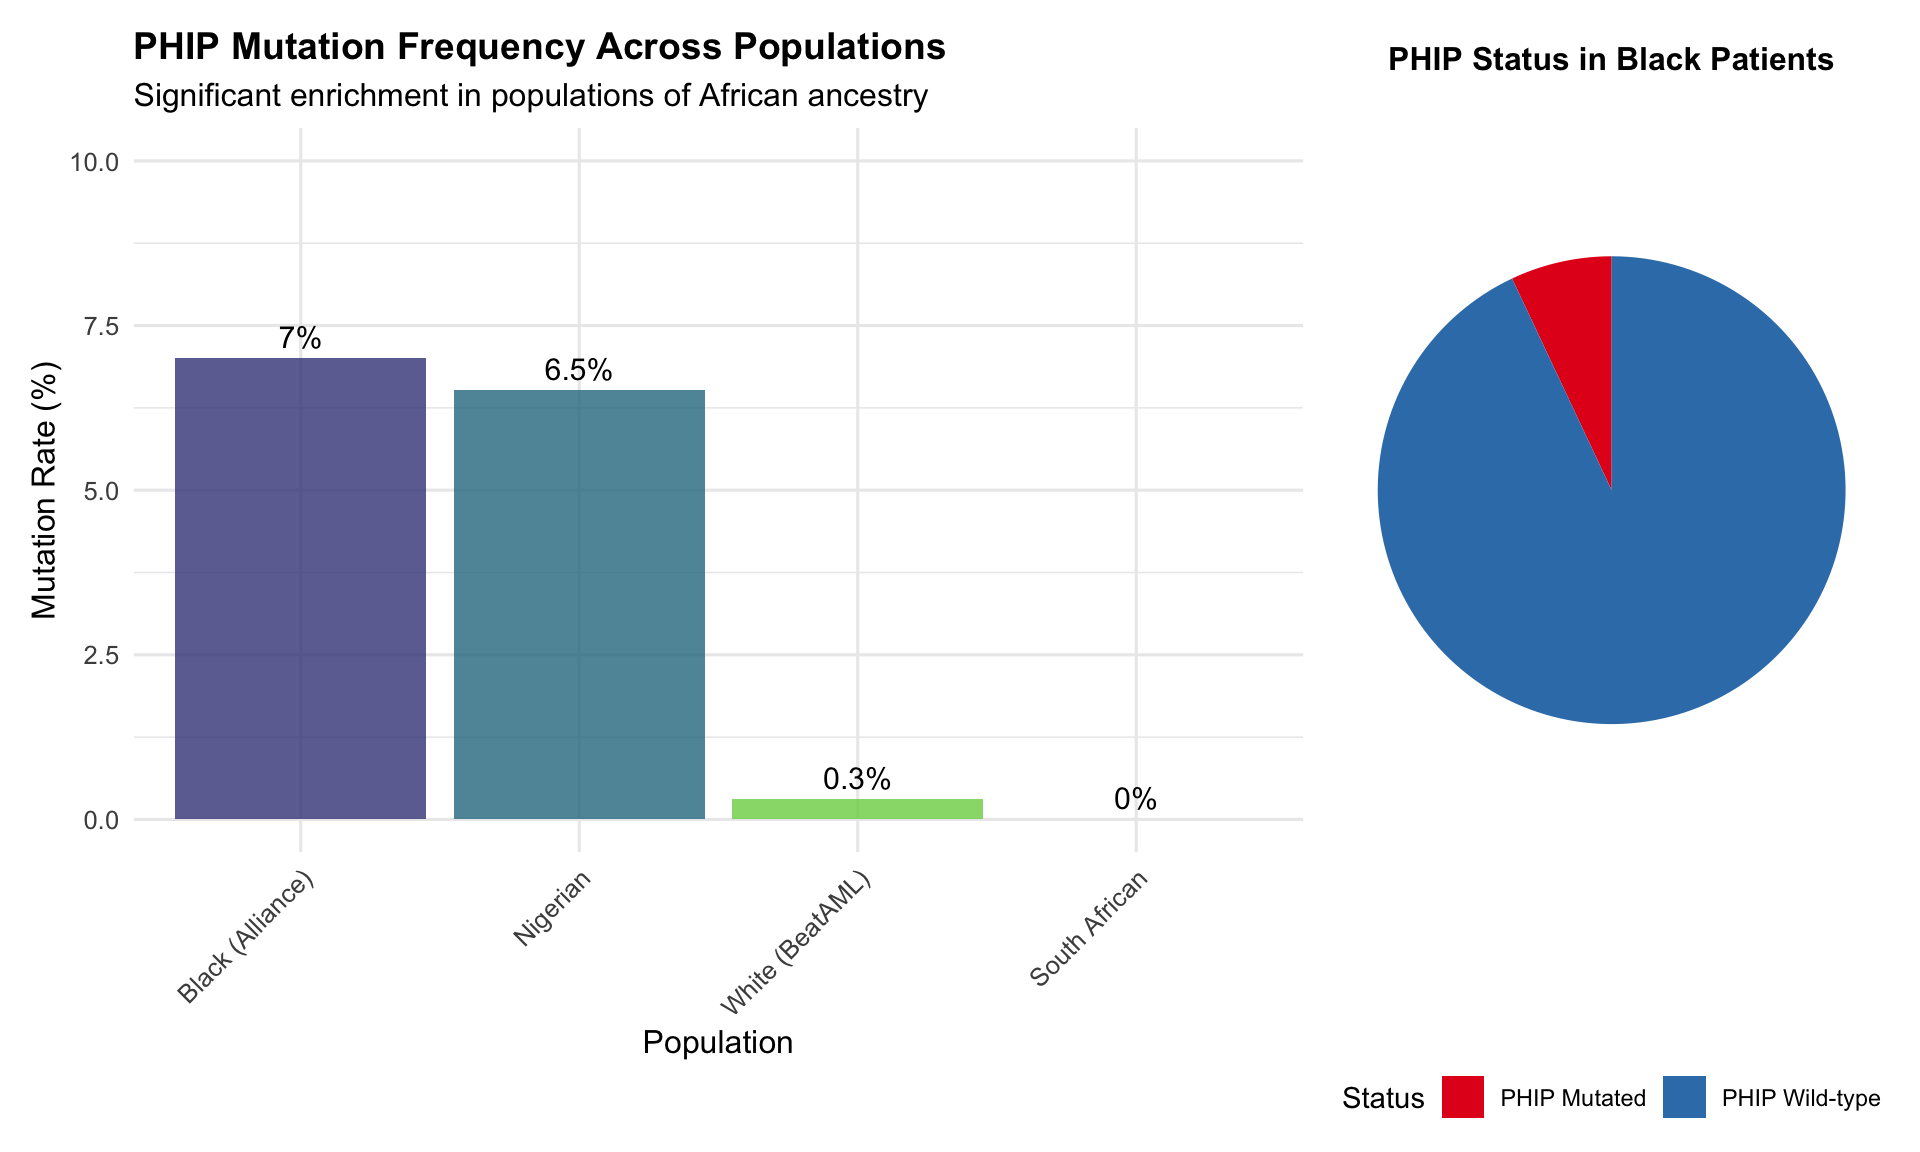
2.4.2 Visualization of Mutation Frequencies

Code
# Create bar plot
p1 <- ggplot(mutation_freq, aes(x = reorder(Population, -Mutation_Rate), 
                                 y = Mutation_Rate, fill = Population)) +
  geom_bar(stat = "identity", alpha = 0.8) +
  geom_text(aes(label = paste0(round(Mutation_Rate, 1), "%")), 
            vjust = -0.5, size = 4) +
  scale_fill_viridis_d(option = "D", begin = 0.2, end = 0.8) +
  labs(
    title = "PHIP Mutation Frequency Across Populations",
    x = "Population",
    y = "Mutation Rate (%)",
    subtitle = "Significant enrichment in populations of African ancestry"
  ) +
  theme(
    legend.position = "none",
    plot.title = element_text(face = "bold", size = 14),
    axis.text.x = element_text(angle = 45, hjust = 1)
  ) +
  ylim(0, 10)

# Create pie chart for Black patients
p2 <- mutation_freq %>%
  filter(Population == "Black (Alliance)") %>%
  pivot_longer(cols = c(PHIP_Mutated, Not_Mutated), 
               names_to = "Status", 
               values_to = "Count") %>%
  mutate(Status = ifelse(Status == "PHIP_Mutated", "PHIP Mutated", "PHIP Wild-type")) %>%
  ggplot(aes(x = "", y = Count, fill = Status)) +
  geom_bar(stat = "identity", width = 1) +
  coord_polar("y", start = 0) +
  scale_fill_manual(values = c("PHIP Mutated" = "#E41A1C", "PHIP Wild-type" = "#377EB8")) +
  labs(
    title = "PHIP Status in Black Patients",
    fill = "Status"
  ) +
  theme_void() +
  theme(
    plot.title = element_text(face = "bold", size = 12, hjust = 0.5),
    legend.position = "bottom"
  )

# Combine plots
p1 + p2 + plot_layout(widths = c(2, 1))

2.5 Statistical Analysis

Code
# Fisher's exact test: Black vs White
black_white_table <- matrix(
  c(7, 93, 1, 322),  # PHIP mutated, PHIP wild-type for Black and White
  nrow = 2,
  dimnames = list(
    Population = c("Black", "White"),
    PHIP_Status = c("Mutated", "Wild-type")
  )
)

# Perform Fisher's exact test
fisher_result <- fisher.test(black_white_table)

# Create a nice output
cat("Fisher's Exact Test: Black vs White PHIP Mutation Frequency\n")
Fisher's Exact Test: Black vs White PHIP Mutation Frequency
Code
cat("============================================\n")
============================================
Code
cat("P-value:", formatC(fisher_result$p.value, format = "e", digits = 3), "\n")
P-value: 2.252e-04 
Code
cat("Odds Ratio:", round(fisher_result$estimate, 2), "\n")
Odds Ratio: 24.03 
Code
cat("95% CI:", round(fisher_result$conf.int[1], 2), "-", 
    round(fisher_result$conf.int[2], 2), "\n")
95% CI: 3.03 - 1089.12 

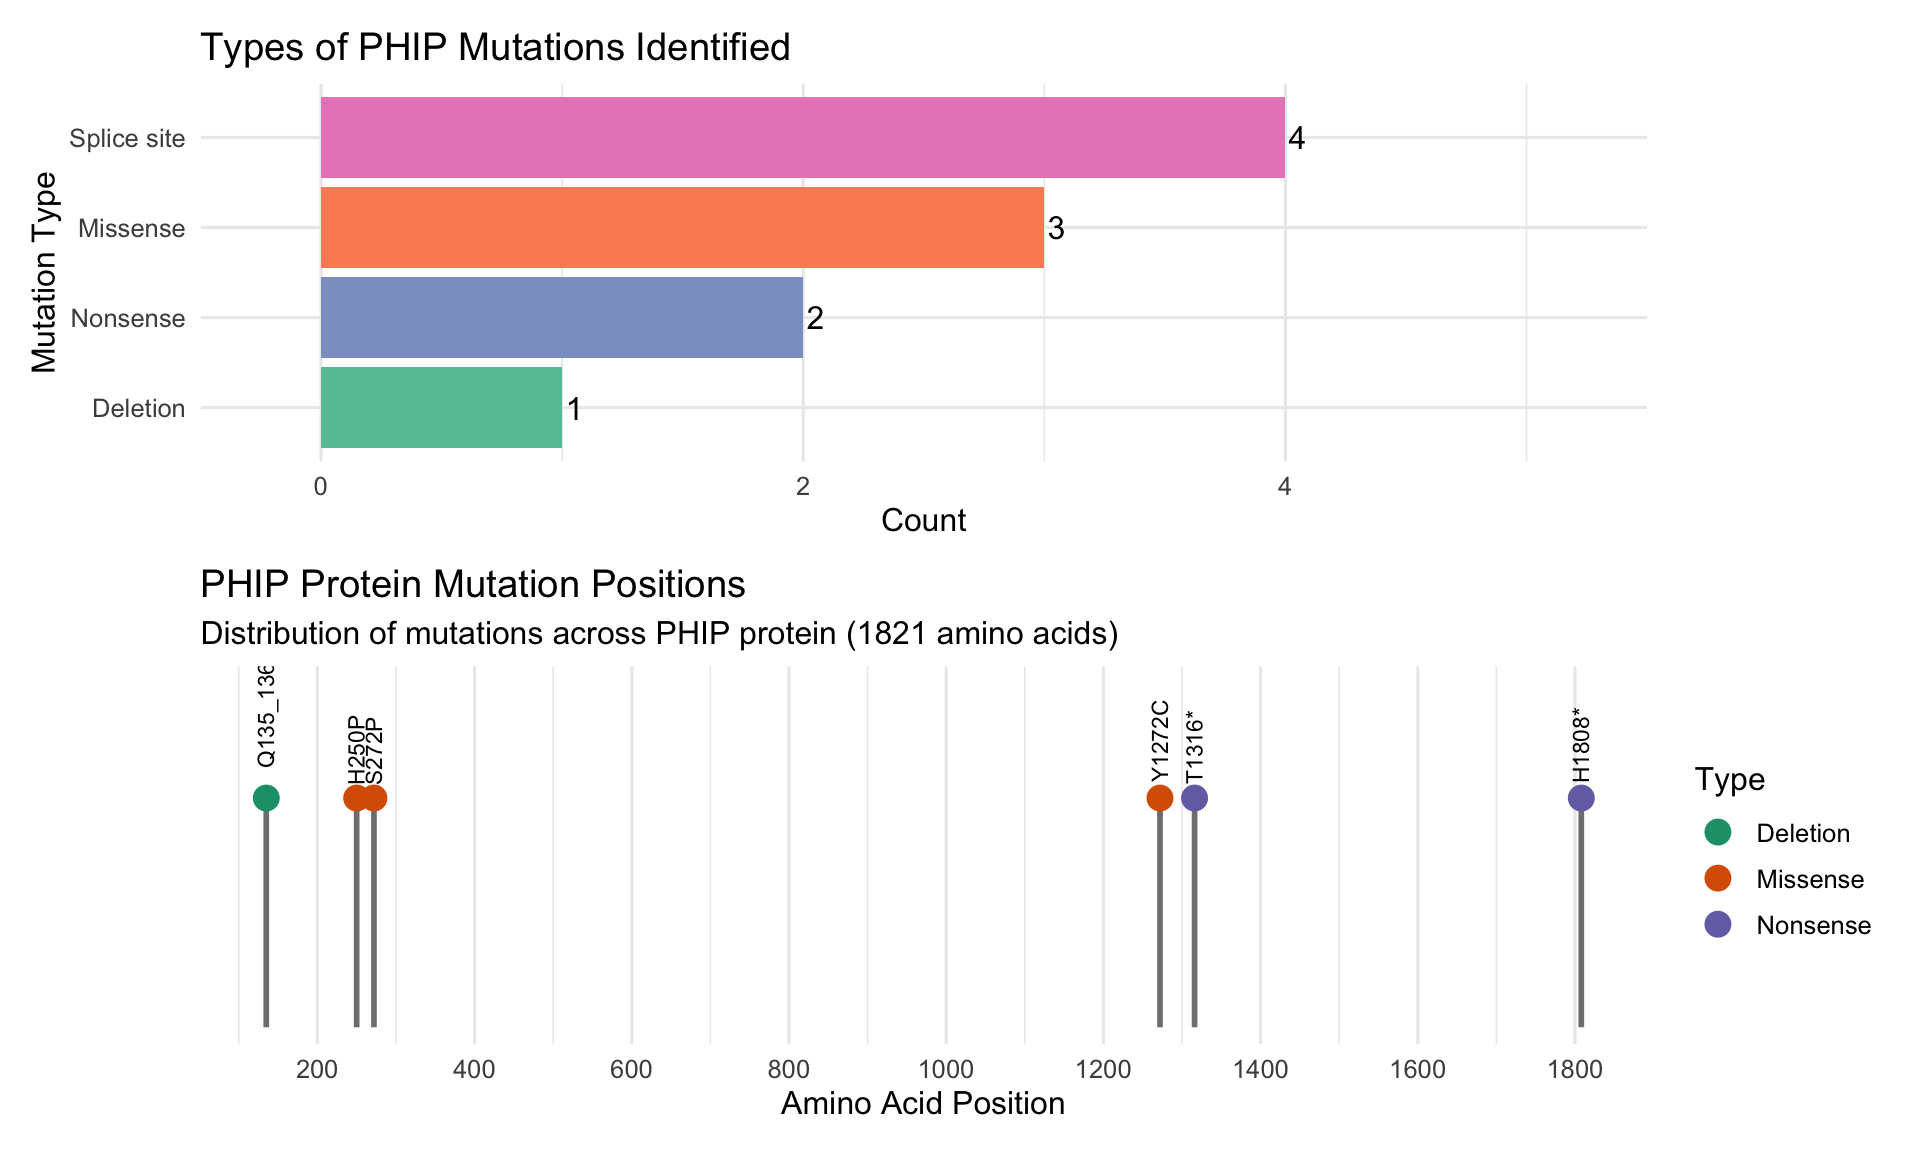
2.6 Mutation Spectrum Analysis

Code
# Plot mutation types
p3 <- phip_mutations %>%
  count(Type) %>%
  ggplot(aes(x = reorder(Type, n), y = n, fill = Type)) +
  geom_bar(stat = "identity") +
  geom_text(aes(label = n), hjust = -0.2) +
  coord_flip() +
  scale_fill_brewer(palette = "Set2") +
  labs(
    title = "Types of PHIP Mutations Identified",
    x = "Mutation Type",
    y = "Count"
  ) +
  theme(legend.position = "none") +
  scale_y_continuous(limits = c(0, 5), expand = c(0, 0.5))

# Create lollipop plot for mutation positions
p4 <- phip_mutations %>%
  filter(!is.na(Position)) %>%
  ggplot(aes(x = Position, y = 1)) +
  geom_segment(aes(x = Position, xend = Position, y = 0, yend = 1), 
               color = "gray50", size = 1) +
  geom_point(aes(color = Type), size = 4) +
  geom_text(aes(label = Mutation), angle = 90, hjust = -0.2, size = 3) +
  scale_color_brewer(palette = "Dark2") +
  scale_x_continuous(breaks = seq(0, 2000, 200)) +
  labs(
    title = "PHIP Protein Mutation Positions",
    x = "Amino Acid Position",
    y = "",
    subtitle = "Distribution of mutations across PHIP protein (1821 amino acids)"
  ) +
  theme(
    axis.text.y = element_blank(),
    axis.ticks.y = element_blank(),
    panel.grid.major.y = element_blank(),
    panel.grid.minor.y = element_blank()
  ) +
  ylim(0, 1.5)

p3 / p4

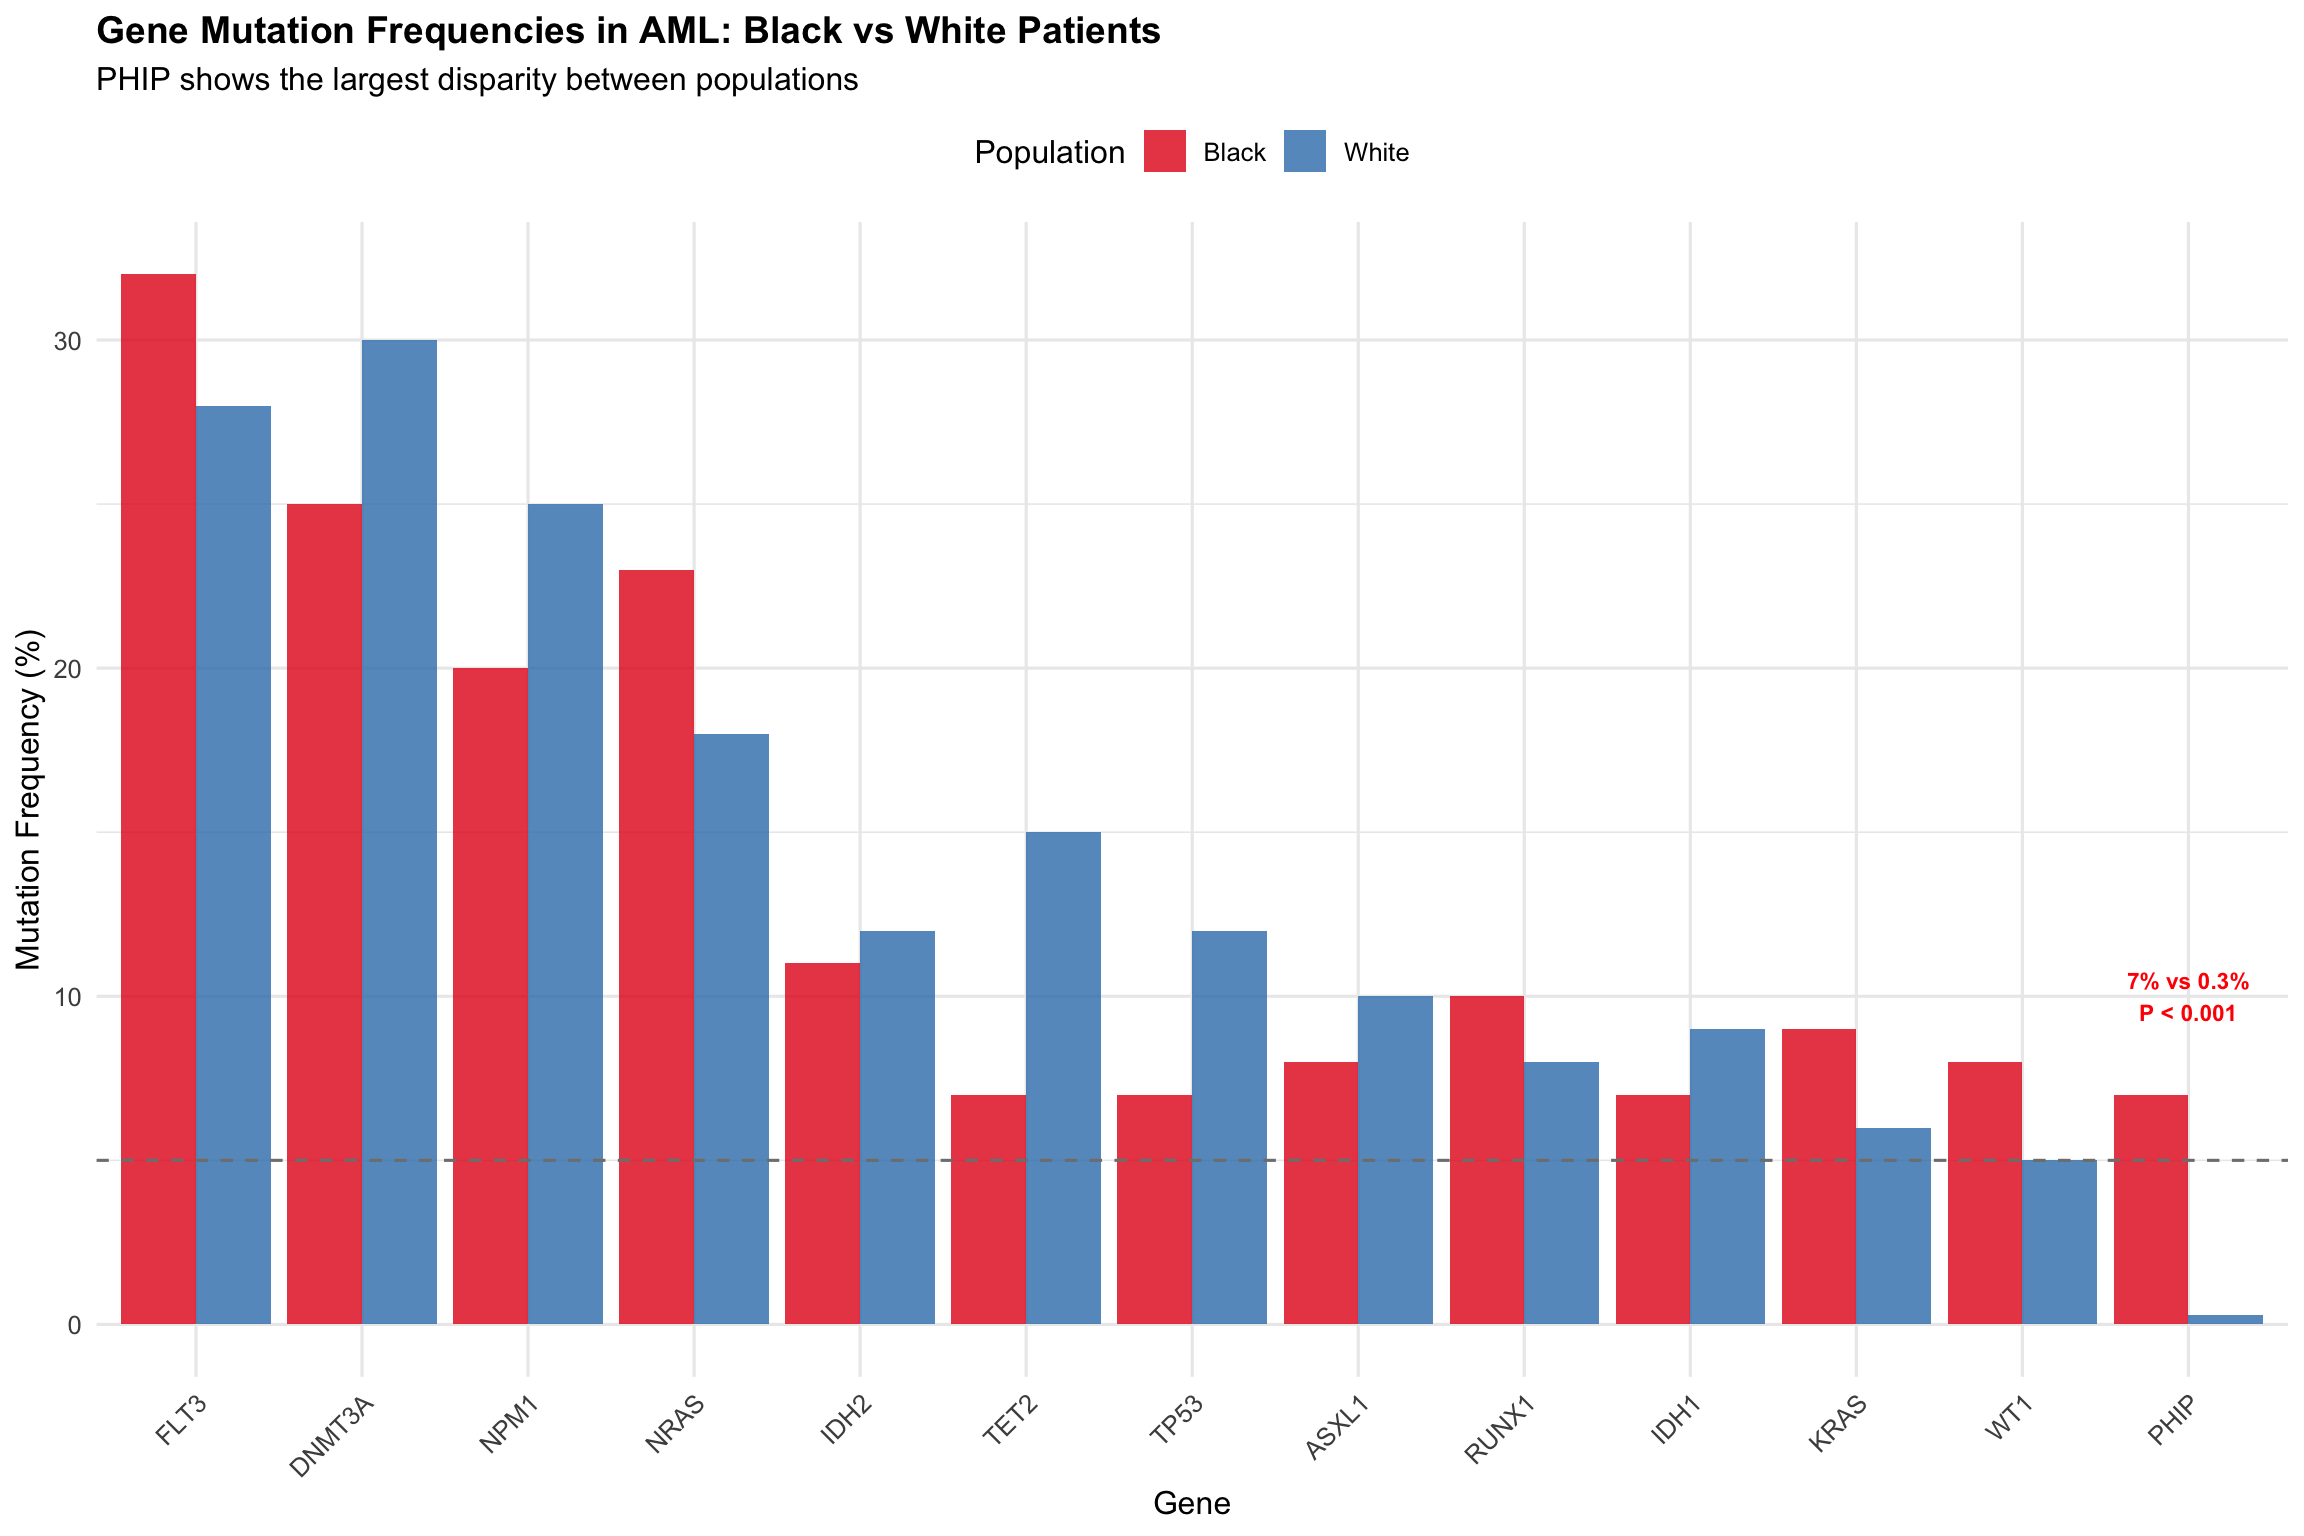
2.7 Comparison with Other AML Genes

Code
# Create grouped bar plot
ggplot(gene_comparison, aes(x = reorder(Gene, -Frequency), 
                            y = Frequency, 
                            fill = Population)) +
  geom_bar(stat = "identity", position = "dodge", alpha = 0.8) +
  geom_hline(yintercept = 5, linetype = "dashed", color = "gray50") +
  scale_fill_manual(values = c("Black" = "#E41A1C", "White" = "#377EB8")) +
  labs(
    title = "Gene Mutation Frequencies in AML: Black vs White Patients",
    subtitle = "PHIP shows the largest disparity between populations",
    x = "Gene",
    y = "Mutation Frequency (%)"
  ) +
  theme(
    axis.text.x = element_text(angle = 45, hjust = 1),
    legend.position = "top",
    plot.title = element_text(face = "bold", size = 14)
  ) +
  annotate(
    "text", 
    x = "PHIP", 
    y = 10, 
    label = "7% vs 0.3%\nP < 0.001", 
    size = 3, 
    fontface = "bold",
    color = "red"
  )

2.8 Nigerian Patient Characteristics

Code
nigerian_patients %>%
  kable(
    col.names = c("Patient ID", "Age (years)", "Sex", "PHIP Status"),
    caption = "Nigerian patients with PHIP mutations"
  ) %>%
  kable_styling(
    bootstrap_options = c("striped", "hover"),
    full_width = FALSE
  ) %>%
  column_spec(4, bold = TRUE, color = "white", background = "#E41A1C")
Nigerian patients with PHIP mutations
Patient ID Age (years) Sex PHIP Status
NG_1 5 Male Mutated
NG_2 31 Male Mutated
NG_3 42 Female Mutated

2.9 Interactive Visualization

Code
# Create interactive plot with plotly
p_interactive <- mutation_freq %>%
  plot_ly(
    x = ~Population,
    y = ~Mutation_Rate,
    type = 'bar',
    text = ~paste("Total patients:", Total_Patients, 
                  "<br>PHIP mutations:", PHIP_Mutated,
                  "<br>Rate:", round(Mutation_Rate, 2), "%"),
    hoverinfo = 'text',
    marker = list(
      color = ~Mutation_Rate,
      colorscale = 'Viridis',
      showscale = TRUE,
      colorbar = list(title = "Mutation Rate (%)")
    )
  ) %>%
  layout(
    title = "Interactive PHIP Mutation Frequency",
    xaxis = list(title = "Population"),
    yaxis = list(title = "Mutation Rate (%)")
  )

p_interactive

2.10 Summary and Clinical Implications

Code
# Create summary statistics
summary_stats <- list(
  "Fold change (Black vs White)" = round(7 / 0.3, 1),
  "Number needed to screen (Black)" = round(100 / 7),
  "Number needed to screen (White)" = round(100 / 0.3),
  "Total mutations identified" = 10,
  "Mutation types" = 4
)

# Display as a nice table
data.frame(
  Metric = names(summary_stats),
  Value = unlist(summary_stats)
) %>%
  kable(
    caption = "Key PHIP mutation statistics"
  ) %>%
  kable_styling(
    bootstrap_options = c("striped", "hover"),
    full_width = FALSE
  ) %>%
  row_spec(1, bold = TRUE, background = "#ffcccc")
Key PHIP mutation statistics
Metric Value
Fold change (Black vs White) Fold change (Black vs White) 23.3
Number needed to screen (Black) Number needed to screen (Black) 14.0
Number needed to screen (White) Number needed to screen (White) 333.0
Total mutations identified Total mutations identified 10.0
Mutation types Mutation types 4.0

2.11 Conclusions

ImportantKey Findings
  • PHIP mutations are significantly enriched in Black AML patients (7% vs 0.3%, P < 0.001)
  • This represents a 23-fold higher frequency in Black patients
  • 10% of Black patients lack mutations in standard 56-gene panels
  • PHIP should be considered for inclusion in clinical NGS panels, especially for patients of African ancestry

2.12 Session Information

Code
sessionInfo()
R version 4.6.1 (2026-06-24)
Platform: aarch64-apple-darwin23
Running under: macOS Tahoe 26.6

Matrix products: default
BLAS:   /Library/Frameworks/R.framework/Versions/4.6/Resources/lib/libRblas.0.dylib 
LAPACK: /Library/Frameworks/R.framework/Versions/4.6/Resources/lib/libRlapack.dylib;  LAPACK version 3.12.1

locale:
[1] en_US.UTF-8/en_US.UTF-8/en_US.UTF-8/C/en_US.UTF-8/en_US.UTF-8

time zone: America/Chicago
tzcode source: internal

attached base packages:
[1] stats     graphics  grDevices utils     datasets  methods   base     

other attached packages:
 [1] scales_1.4.0      viridis_0.6.5     viridisLite_0.4.3 patchwork_1.3.2  
 [5] ggstatsplot_1.0.0 plotly_4.12.1     kableExtra_1.4.1  knitr_1.51       
 [9] lubridate_1.9.5   forcats_1.0.1     stringr_1.6.0     dplyr_1.2.1      
[13] purrr_1.2.2       readr_2.2.0       tidyr_1.3.2       tibble_3.3.1     
[17] ggplot2_4.0.3     tidyverse_2.0.0  

loaded via a namespace (and not attached):
 [1] gtable_0.3.6           xfun_0.60              bayestestR_0.18.1     
 [4] htmlwidgets_1.6.4      insight_1.5.2          paletteer_1.7.0       
 [7] tzdb_0.5.0             crosstalk_1.2.2        vctrs_0.7.3           
[10] tools_4.6.1            generics_0.1.4         datawizard_1.3.1      
[13] pkgconfig_2.0.3        data.table_1.18.4      RColorBrewer_1.1-3    
[16] correlation_0.8.8      S7_0.2.2               RcppParallel_6.2.0    
[19] lifecycle_1.0.5        compiler_4.6.1         farver_2.1.2          
[22] textshaping_1.0.5      htmltools_0.5.9        yaml_2.3.12           
[25] pillar_1.11.1          statsExpressions_2.0.0 tidyselect_1.2.1      
[28] digest_0.6.39          stringi_1.8.7          rematch2_2.1.2        
[31] labeling_0.4.3         fastmap_1.2.0          grid_4.6.1            
[34] cli_3.6.6              magrittr_2.0.5         withr_3.0.3           
[37] timechange_0.4.0       rmarkdown_2.31         httr_1.4.8            
[40] otel_0.2.0             gridExtra_2.3.1        hms_1.1.4             
[43] evaluate_1.0.5         parameters_0.29.2      rstantools_2.7.0      
[46] rlang_1.3.0            glue_1.8.1             xml2_1.6.0            
[49] svglite_2.2.2          rstudioapi_0.19.0      jsonlite_2.0.0        
[52] effectsize_1.0.3       R6_2.6.1               systemfonts_1.3.2