EHA 2026: Top 10 in AML & MPN
A Blood Cancer Talks reading guide — what the data say, and how sure we should be
Division of Hematology/Oncology, Vanderbilt University Medical Center
2026-06-01
How to read this meeting
Ten abstracts — five in AML, five in MPN — chosen for visibility and likely impact on practice. Throughout, one recurring discipline (the Frank Harrell lens):
Match your confidence to the design. A 96% response in a single arm, a non-inferiority result, an immature survival hazard ratio, and a 4-of-12 signal each deserve a different kind of belief. Watch four things in every slide:
- The denominator — small n means wide intervals, even behind a big percentage.
- The endpoint — is it something the patient feels, something that predicts survival, or just something that moves?
- The threshold — responder cutoffs (SVR35, TSS50) and significance boundaries are choices, not facts.
- The comparator — single-arm response rates have no concurrent control to anchor them.
Selected figures drawn from sponsor releases, JCO, and congress reporting. Confirm every number against the EHA 2026 presentations before citing.
Part 1 — Acute Myeloid Leukemia
Menin inhibitors arrive in front line · the venetoclax era gets refined · the first switchable allogeneic CAR-T
Menin inhibition moves to front line
KOMET-007 · Abstract S130 · ziftomenib + 7+3
90–96%
Composite CR (NPM1 / KMT2A)
~94%
12-month OS (NPM1 cohort)
~99
Newly diagnosed patients
- Ziftomenib (selective oral menin inhibitor) added to standard cytarabine + daunorubicin induction
- One of the largest frontline menin + intensive-chemo datasets to date; deep MRD negativity in responders
- First FDA-approved menin inhibitor for R/R NPM1-mutant AML (Nov 2025); phase 3 KOMET-017 now enrolling
Read with care. Single-arm, and patients had to be fit for 7+3. NPM1-mutant AML is favorable-risk to begin with — some of that 90%+ and that 94% one-year survival is who enrolled, not only what the drug did. The KMT2A-rearranged subset, where the need is real, is the one to judge separately. “Backbone” is a randomized-trial claim.
A near-identical signal from the other menin inhibitor
SNDX-5613-0708 · Abstract PF489 · revumenib + intensive chemo
97%
Composite CR (34/35)
77%
CR (27/35)
=
Similar at both dose levels
- Revumenib added to 7+3-type induction in newly diagnosed KMT2A / NPM1 / NUP98 AML
- Earliest DL1 cohort (n=7): CR / CRc / ORR all 100%, all-evaluable MRD-negative CR; PK above the menin–KMT2A IC90
- Pairs directly with KOMET-007 — two menin inhibitors entering front line at once
The 7-patient “100%.” A 100% response in 7 patients has a Wilson 95% CI of roughly 65–100% — one fewer responder swings it hard. And with response rates equal at DL1 and DL2 while both clear the PK threshold, the Project-Optimus question is whether the lower dose is the right one. (See the certainty figure two slides on.)
Finally, a randomized answer on venetoclax duration
OPTI-AML · Abstract S126 · 28- vs 14-day VEN + AZA
- Prospective randomized phase 2 nested in Beat AML; older (≥60), unfit, genomically agnostic AML
- 28-day vs 14-day venetoclax with azacitidine for the first 2 cycles
- Primary endpoint: CR rate; non-inferiority design (~10-point margin vs the VIALE-A ~36% reference)
- Motivation: 28-day dosing drives prolonged cytopenias and interruptions in >50% of patients
Non-inferiority ≠ equivalence. A NI “win” against a ~10-point margin is not proof the two are the same, and the margin itself is a value judgment. If 14 days lands a few points lower on CR but markedly cuts febrile neutropenia and hospital days, that may be the better regimen even when the headline reads “non-inferior.” The binary CR endpoint also discards information that matters more to an unfit patient — time neutropenic, transfused, hospitalized.
Beat AML Master Trial sub-study · NCT03013998. EHA 2026 efficacy/toxicity readout — confirm arm-level figures from the presentation.
Adding a third drug in FLT3-ITD AML
Abstract PF509 · quizartinib + decitabine + venetoclax
94%
Composite CR — newly dx (28/30)
70%
CR — newly diagnosed
61%
Composite CR — R/R
- Triplet in FLT3-ITD AML; most newly diagnosed responders became FLT3-negative by flow and PCR
- R/R cohort more modest: 61% composite CR, median OS 6.3 months
- Dose lesson: higher quizartinib (40 mg) produced grade 4 myelosuppression → RP2D dropped to ~26.5–30 mg/day
In triplets, toxicity defines the deliverable regimen — not the response rate. A 94% composite CR is striking, but the dose-limiting myelosuppression is the part that determines what actually gets prescribed. Count recovery and the frontline-vs-R/R gap matter as much as the headline.
First switchable allogeneic CAR-T in AML
REVSTAR-123 · Abstract LB5007 (plenary late-breaker) · CD123
- Off-the-shelf allogeneic CAR-T against CD123, activity gated by a separately infused targeting module — a pharmacologic on/off switch
- The switch addresses on-target/off-tumor risk: CD123 sits on normal progenitors and endothelium too
- Phase 1a: 4 responses / 12 evaluable, all at the two highest doses; 3/8 CR or CRh at top doses (2 MRD-negative)
A dose–response pattern, or small-sample noise? Responses clustering at the top doses is encouraging — but in a 17-patient first-in-human study it is exactly the pattern that can appear by chance. Enthusiasm proportionate to size: this is a proof of concept, not yet an efficacy result. The CI on 4/12 runs ~14–61%.
Part 2 — Myeloproliferative Neoplasms
A tale of endpoints in myelofibrosis · the first anti-mutCALR antibody · an answer in ET
A split decision on co-primaries
SENTRY · Abstract LB5002 · selinexor + ruxolitinib
49.8%
SVR35 vs 28.0% placebo
2.58
Odds ratio (P < 0.0001)
✗
Symptom co-primary missed
- Selinexor + ruxolitinib in JAK-inhibitor-naïve myelofibrosis (frontline); randomized, placebo-controlled phase 3
- Clear spleen win; the symptom co-primary flatly missed — both arms improved similarly
- Much-discussed immature OS signal, hazard ratio ≈ 0.43 (not powered for survival)
Spleen moved; symptoms didn’t. That disconnect asks how well SVR35 tracks what patients feel. And a 0.43 from an immature, underpowered survival analysis is a hypothesis, not a result — it can move substantially as events accrue. One co-primary met, one missed: positive-with-an-asterisk.
Statistically negative, clinically close
INDEPENDENCE · Abstract S215 · luspatercept
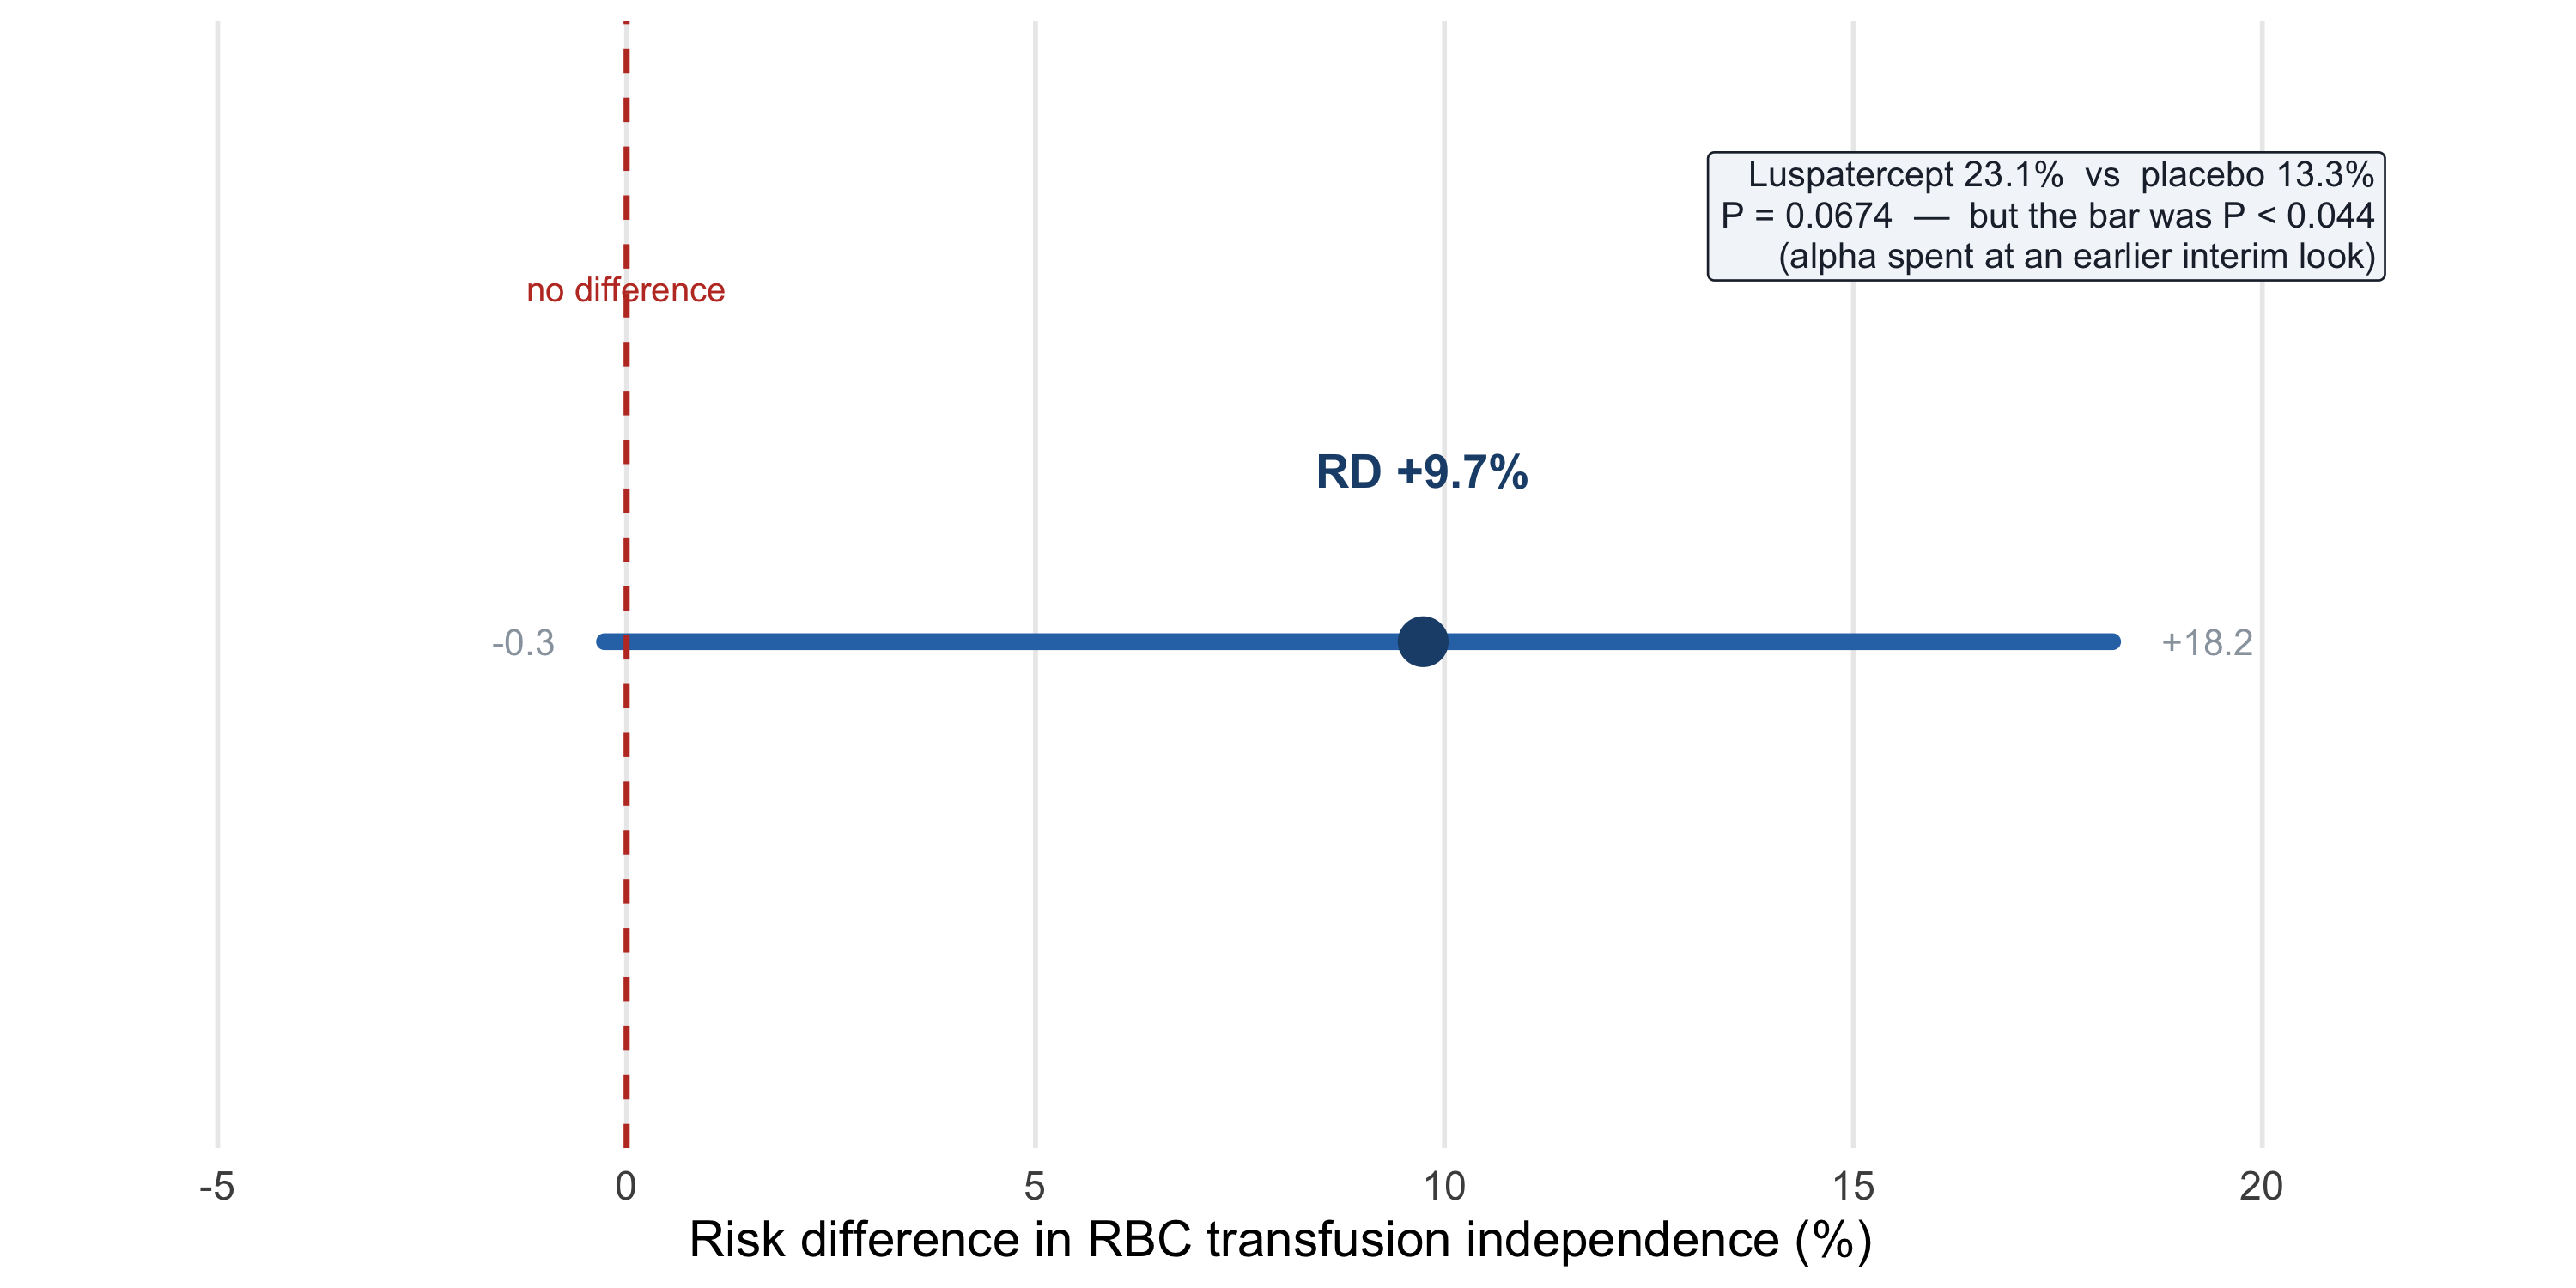
Figure 1: Risk difference in RBC transfusion independence. The 95% CI just touches zero, and the significance bar was P < 0.044 — not 0.05 — because alpha was spent at an earlier interim look.
A failed trial, or a successful drug with an unlucky threshold? Supportive secondaries (fewer transfusions, higher hemoglobin) point to a drug that works. Don’t let one cut point convert a 9.7-point absolute gain into “inert.” A continuous endpoint might have captured the benefit the binary missed.
First-in-class against a tumor-specific neoantigen
INCA033989 · Abstract S216 · anti-mutant-calreticulin antibody
~70%
Complete hematologic response (ET)
↓ VAF
mutCALR allele burden
BTD
Breakthrough; phase 3 mid-2026
- Monoclonal antibody against mutant calreticulin — a true surface neoantigen, essentially absent from normal cells
- Spleen, symptom, and anemia responses in MF; ~70% CHR in ET; monotherapy and with ruxolitinib
- VAF reductions even amid high clonal complexity — cited as evidence of disease modification
Disease modification rests on a surrogate here. These are phase 1, safety-primary, uncontrolled studies; efficacy signals are secondary. VAF reduction is a surrogate until a randomized trial says otherwise. Pin down cohort sizes, response definitions, and durations before believing the “rapid, robust, sustained” framing.
After a type I JAK2 inhibitor fails
AJ1-11095 (AJX-101) · Abstract S218 · type II JAK2 inhibitor
~70%
SVR35 (best response)
21/23
Reduced driver-mutation VAF
0
AE discontinuations / DLTs
- First type II JAK2 inhibitor (binds the inactive conformation); blocks JAK2 homo- and heterodimerization
- Post-ruxolitinib population (all prior type I exposure); 65% SVR35 at the week-12 landmark, rising toward 70% best response
- 19/23 still on therapy; cytopenias the main dose-dependent toxicity
Don’t blur landmark and best-response, and respect the rule of three. “Best response at any time” almost always exceeds a fixed-timepoint rate. And “no DLTs in 23” still permits a true rate near 13% (rule of three). Encouraging, differentiated mechanism — but n=23.
An answer in essential thrombocythemia
SURPASS-ET · Abstract S219 · ropeginterferon, early vs delayed
- Ropeginterferon vs anagrelide as 2nd-line ET after hydroxyurea — first new ET option since anagrelide (1997)
- EHA readout: 2-year early-vs-delayed-initiation analysis favoring earlier interferon on durable responses and PFS
- Anti-clonal interferon, already approved in polycythemia vera
Watch for immortal-time bias. “Delayed” patients had to survive and stay progression-free long enough to reach their later start — structure that can manufacture an apparent edge for “early.” And in a disease with near-normal life expectancy, is PFS the right thing to move, or are we over-treating a well patient to shift a surrogate?
The figures behind the thesis
Two visuals that make “match your confidence to the design” concrete
Same headline, different certainty
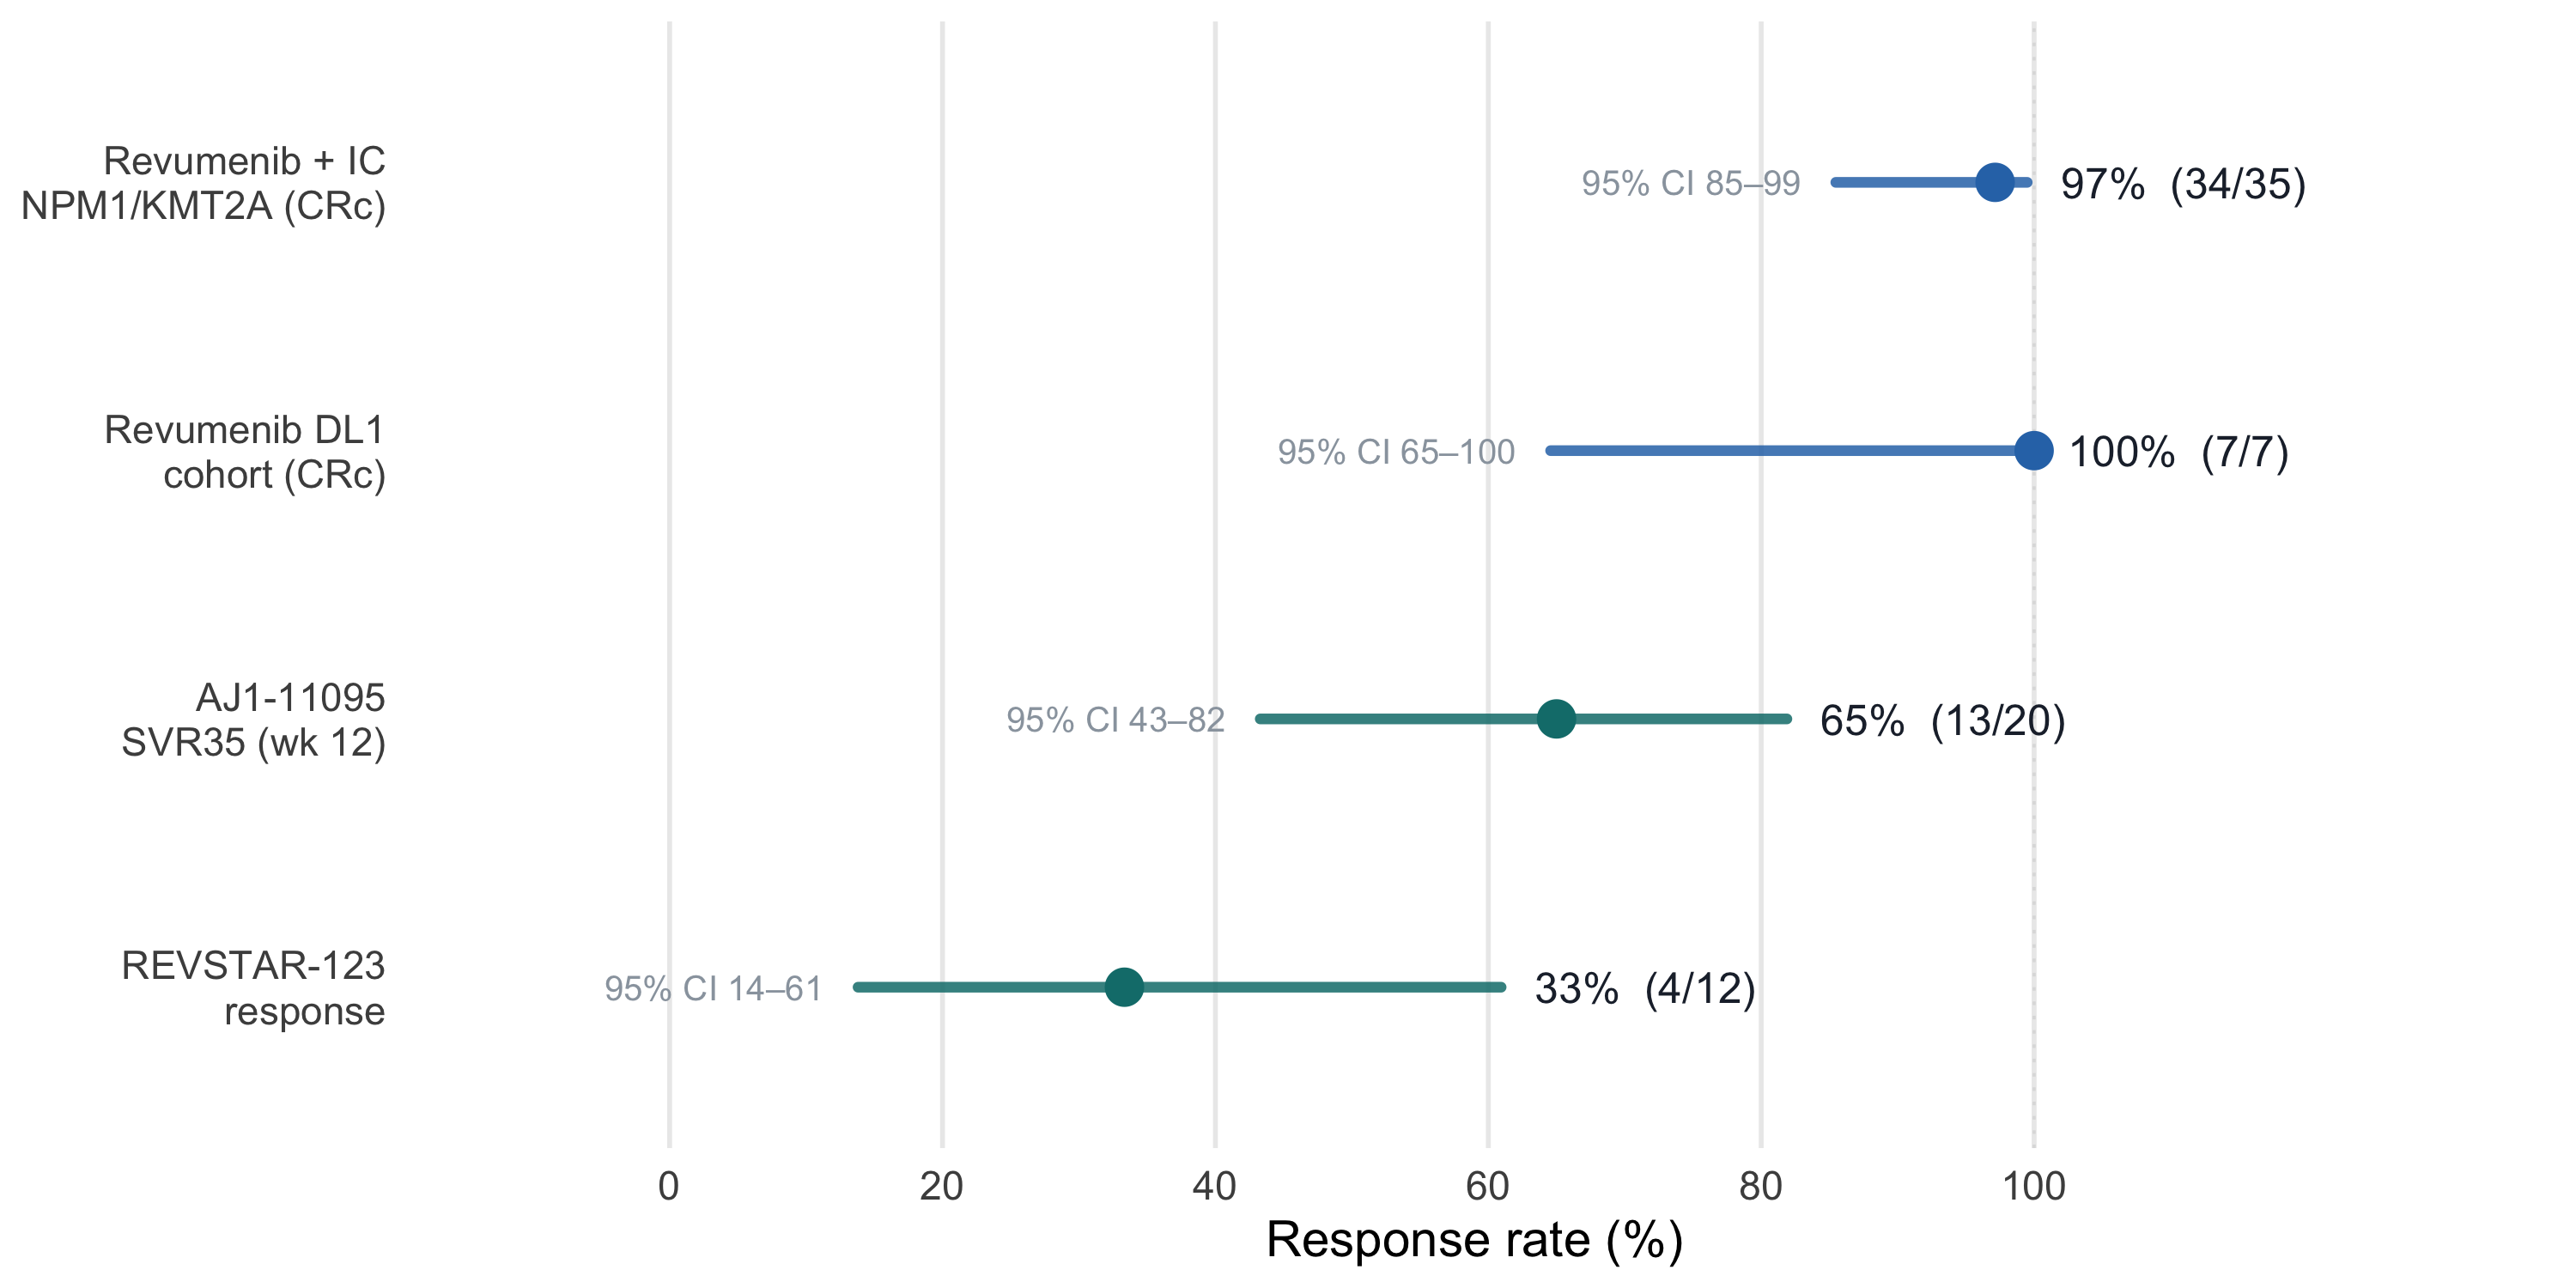
Figure 2: Response rates with 95% Wilson confidence intervals. The percentage you remember is not the whole story — the denominator sets how much to trust it.
Wilson score intervals. A 7-patient “100%” spans 65–100%; a 4-of-12 signal spans 14–61%. Same slide, very different certainty.
SENTRY vs INDEPENDENCE: mirror images
SENTRY — met one co-primary (spleen, P<0.0001), missed the other (symptoms). A positive trial with a caveat, plus an immature OS signal not to over-read.
INDEPENDENCE — missed its primary by a whisker (P=0.0674 vs a 0.044 boundary), with supportive secondaries. A negative trial that may be a successful drug.
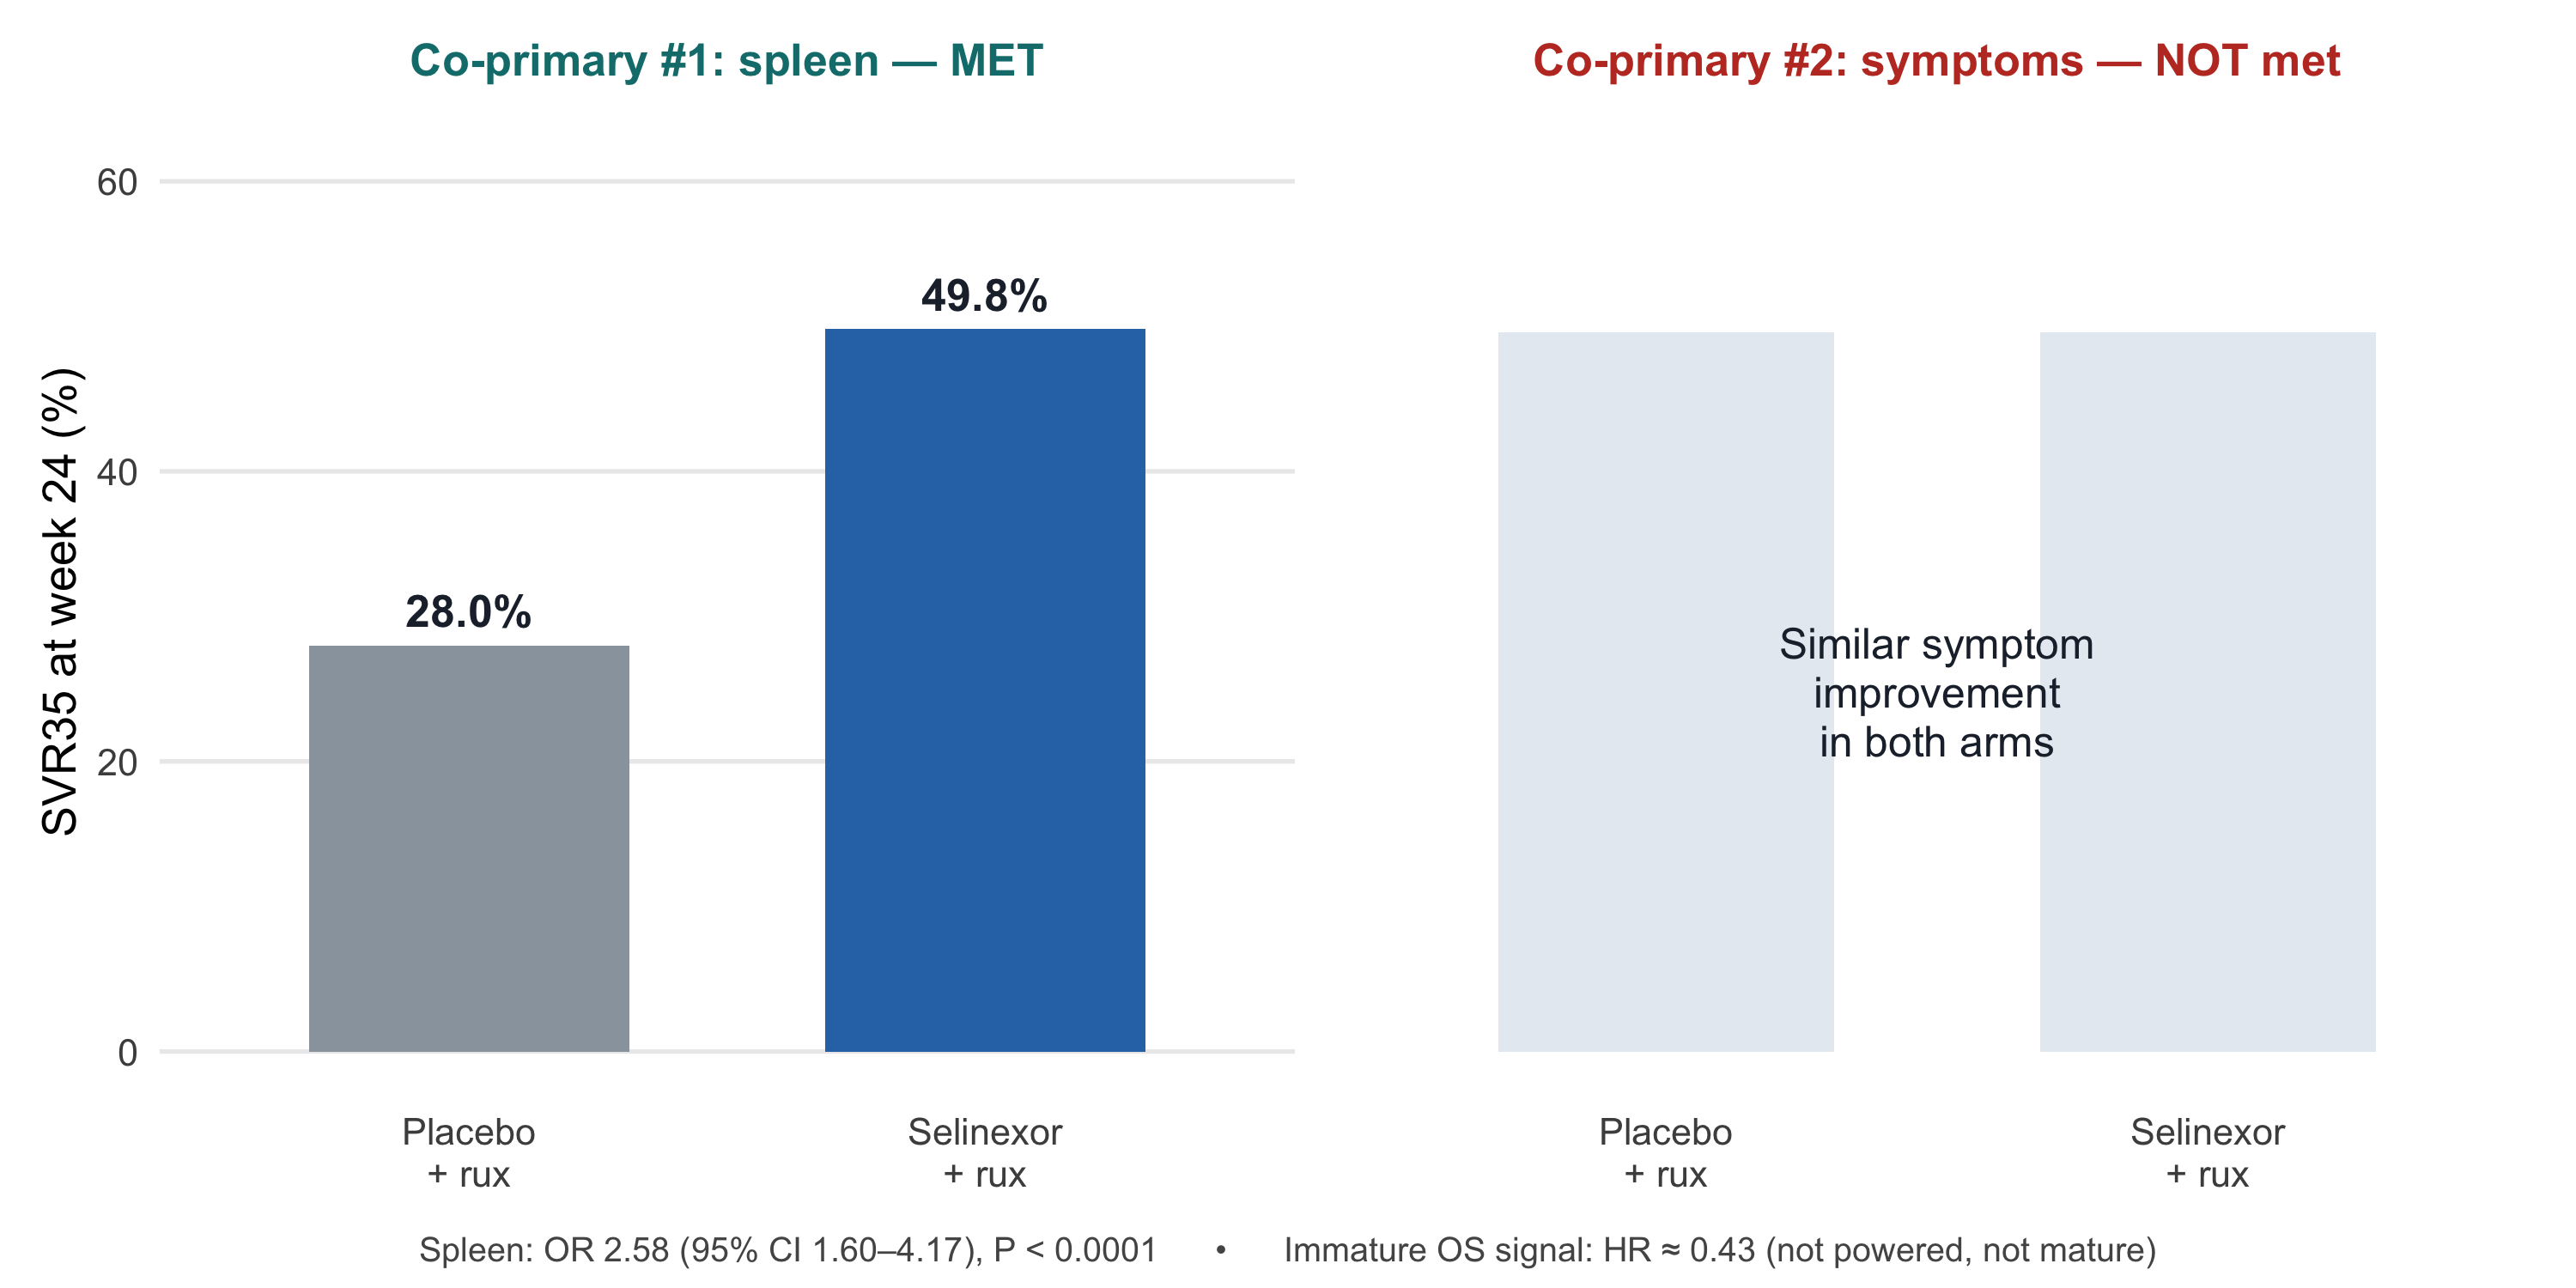
Figure 3: SENTRY’s split co-primary: a quantified spleen win beside a symptom endpoint that did not separate.
Closing
What this meeting means
- Menin inhibitors are now a frontline story — ziftomenib and revumenib, from two directions; the registrational head-to-head against chemo-alone is what earns “backbone.”
- The venetoclax era is being optimized, not replaced — OPTI-AML on duration, triplets adding targeted agents where toxicity (not response) sets the dose.
- MPN is a lesson in endpoints — SENTRY and INDEPENDENCE landed opposite ways on similar-sized effects because of what and where they measured; the anti-mutCALR antibody and type II JAK2 inhibitor open genuinely new mechanisms.
“Disease modification” was the phrase of the meeting — invoked for AJ1-11095, INCA033989, and the SENTRY survival signal alike. Before granting any therapy that label, ask whether the endpoint is something the patient feels, something that predicts survival, or simply something that moves. Spleen volume, transfusion counts, symptom scores, and allele burden are not interchangeable — and the most exciting number in a press release is rarely the one that should change practice.
Abstracts referenced
AML — KOMET-007 (S130) · revumenib + IC (PF489, SNDX-5613-0708) · OPTI-AML (S126) · quizartinib/decitabine/venetoclax (PF509) · REVSTAR-123 (LB5007)
MPN — SENTRY (LB5002) · INDEPENDENCE (S215) · INCA033989 (S216) · AJ1-11095 / AJX-101 (S218) · SURPASS-ET (S219)
EHA 2026, Stockholm. Figures compiled from sponsor press releases, JCO, and congress reporting; several values (e.g., the SENTRY OS HR, OPTI-AML and SURPASS-ET arm-level figures) are from immature or secondary sources and must be confirmed against the primary presentations before citation.
Appendix — R equivalents of the figures
The deck runs on Python (matplotlib/scipy). Equivalent R (ggplot2) code for the two CI figures, for those who prefer to render in R:
# ---- Wilson CI forest ("Same headline, different certainty") ----
library(ggplot2); library(dplyr); library(binom)
dat <- tribble(
  ~label,                         ~k, ~n,  ~grp,
  "Revumenib + IC (CRc)",          34, 35, "AML",
  "Revumenib DL1 cohort (CRc)",     7,  7, "AML",
  "AJ1-11095 SVR35 (wk 12)",       13, 20, "MPN",
  "REVSTAR-123 response",           4, 12, "MPN") |>
  mutate(ci = binom.confint(k, n, methods = "wilson"),
         p = ci$mean, lo = ci$lower, hi = ci$upper,
         label = factor(label, levels = rev(label)))
ggplot(dat, aes(p*100, label, colour = grp)) +
  geom_errorbarh(aes(xmin = lo*100, xmax = hi*100), height = 0, linewidth = 1.1) +
  geom_point(size = 4) +
  geom_text(aes(x = hi*100 + 3, label = sprintf("%.0f%% (%d/%d)", p*100, k, n)),
            hjust = 0, colour = "#1F2937") +
  scale_colour_manual(values = c(AML = "#2E75B6", MPN = "#0E7C7B"), guide = "none") +
  scale_x_continuous("Response rate (%)", limits = c(0, 122),
                     breaks = seq(0, 100, 20)) +
  labs(y = NULL, title = "Same headline, different certainty") +
  theme_minimal(base_size = 14) +
  theme(panel.grid.major.y = element_blank(),
        plot.title = element_text(face = "bold", colour = "#1F4E79"))

# ---- INDEPENDENCE risk-difference CI vs alpha-spending boundary ----
library(ggplot2)
rd <- 9.74; lo <- -0.27; hi <- 18.17
ggplot() +
  geom_vline(xintercept = 0, colour = "#C0392B", linetype = "dashed") +
  geom_segment(aes(x = lo, xend = hi, y = 0, yend = 0),
               colour = "#2E75B6", linewidth = 1.6, lineend = "round") +
  geom_point(aes(rd, 0), colour = "#1F4E79", size = 5) +
  annotate("text", x = rd, y = 0.15, label = sprintf("RD +%.1f%%", rd),
           fontface = "bold", colour = "#1F4E79") +
  annotate("label", x = hi, y = 0.6, hjust = 1,
           label = "P = 0.0674 vs a P < 0.044 boundary\n(alpha spent at an earlier interim)",
           fill = "#F3F6FA") +
  scale_x_continuous("Risk difference in RBC transfusion independence (%)",
                     limits = c(-6, 22)) +
  scale_y_continuous(NULL, limits = c(-0.8, 1), breaks = NULL) +
  labs(title = "INDEPENDENCE: statistically negative, clinically close") +
  theme_minimal(base_size = 14) +
  theme(plot.title = element_text(face = "bold", colour = "#1F4E79"))
This deck already renders in R (knitr engine); the figures above are the ggplot2 versions. The matplotlib originals are preserved in the Python edition of this deck.
Blood Cancer Talks · EHA 2026 · Figures: confirm all values against primary presentations