Division of Hematology/Oncology, Vanderbilt University Medical Center
2026-08-18
The Grammar of Graphics
Layered thinking
A plot is built from:
Data — what you’re showing
Aesthetics — mapping variables to visual properties
Geometries — points, lines, bars
Scales, facets, themes — refinement
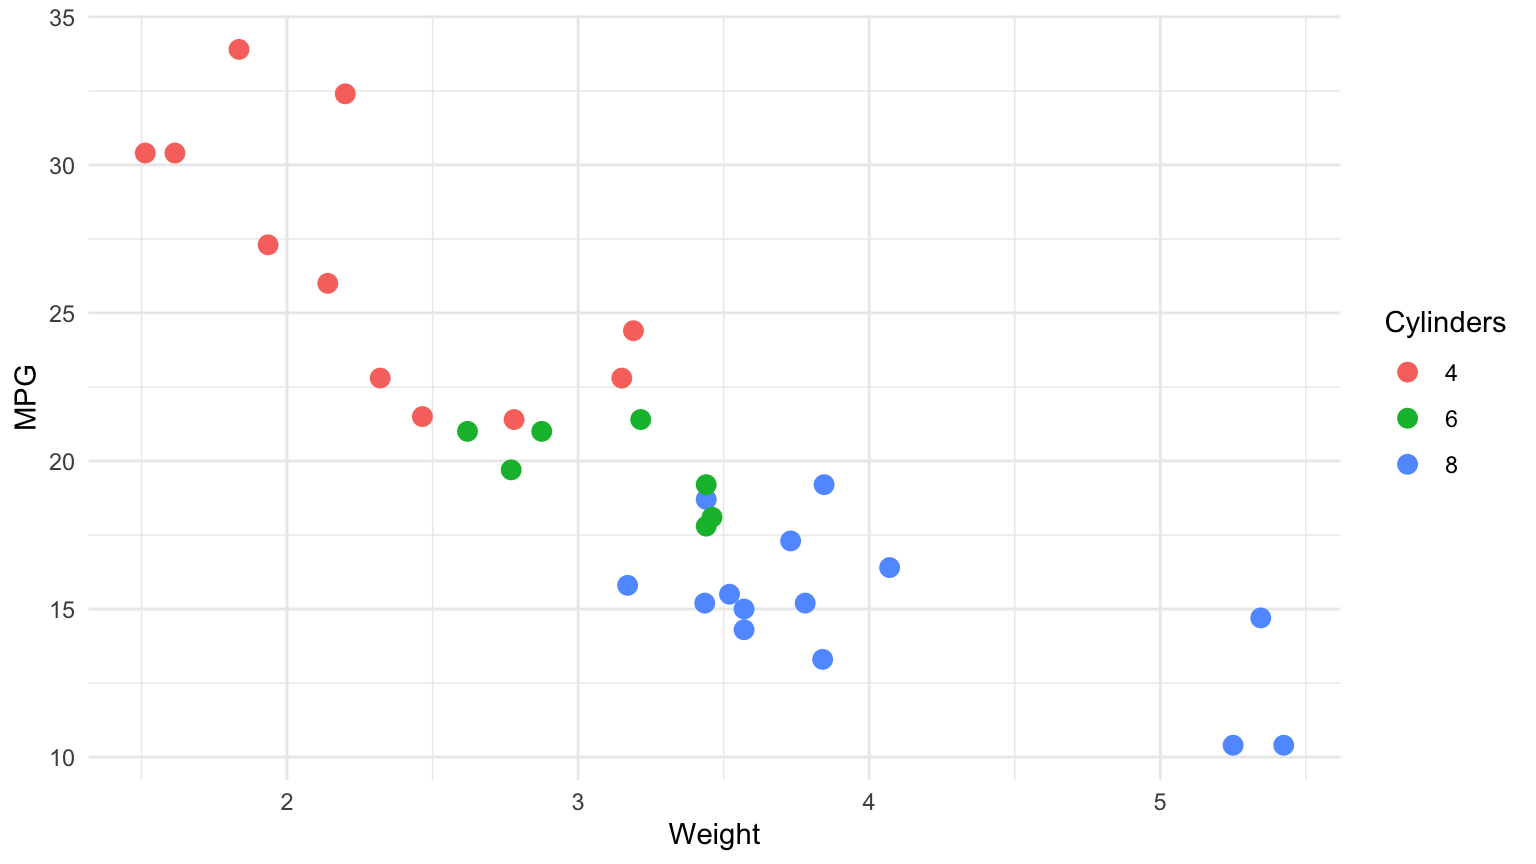
A basic ggplot
library(ggplot2)ggplot(mtcars, aes(x = wt, y = mpg, color =factor(cyl))) +geom_point(size =3) +labs(x ="Weight", y ="MPG", color ="Cylinders") +theme_minimal()
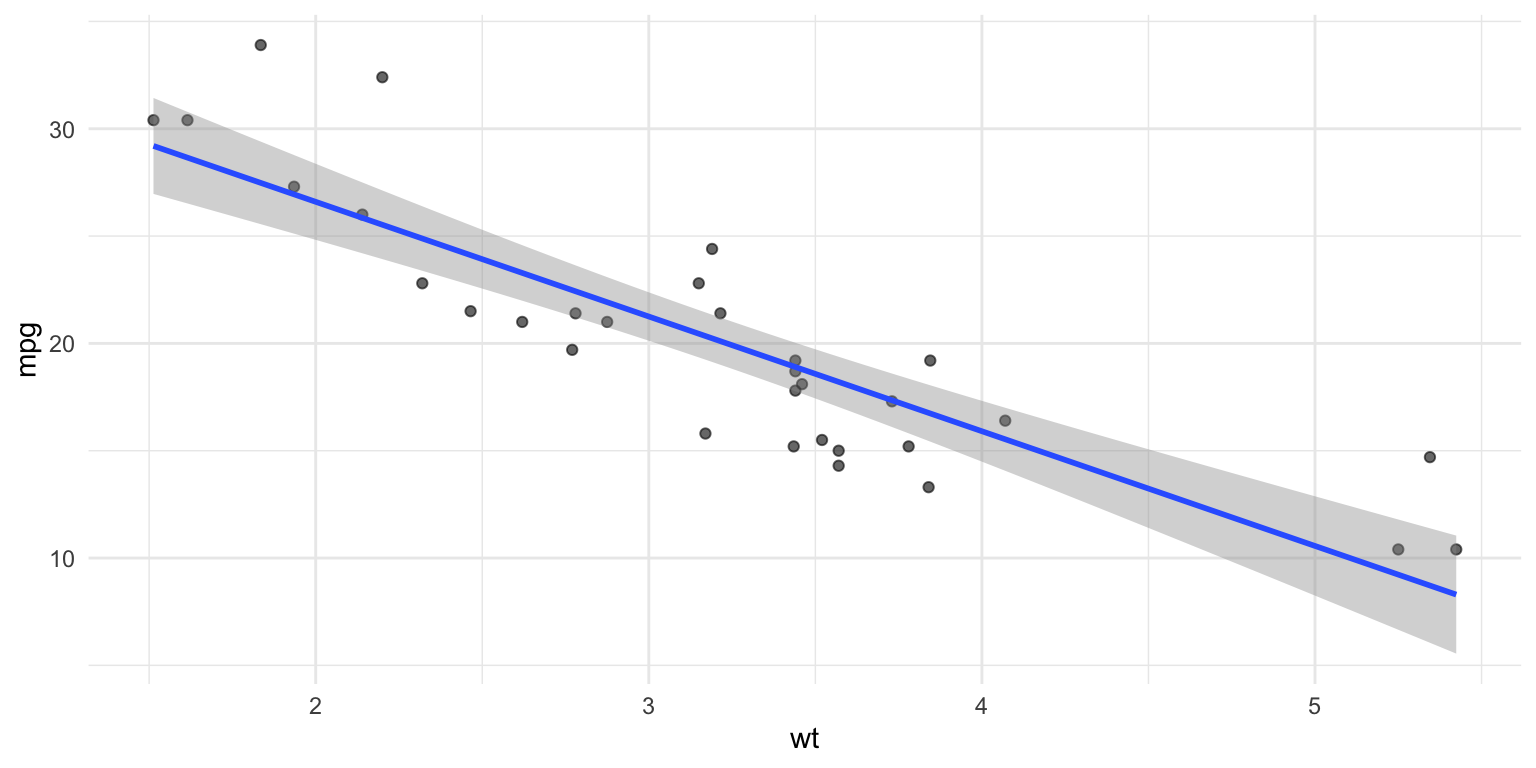
Adding a trend
ggplot(mtcars, aes(wt, mpg)) +geom_point(alpha =0.6) +geom_smooth(method ="lm", se =TRUE) +theme_minimal()