Introduction to Statistics

Topic 01 · Foundations

Ashwin Kishtagari, MBBS, MSCI

Division of Hematology/Oncology, Vanderbilt University Medical Center

2026-08-18

Why Statistics?

The core problem

We have data and want to make decisions under uncertainty.

Statistics gives us the tools to:

  • Summarize what we observe
  • Quantify our uncertainty
  • Generalize beyond our sample

A first look at data

summary(mtcars[, c("mpg", "hp", "wt")])
      mpg              hp              wt       
 Min.   :10.40   Min.   : 52.0   Min.   :1.513  
 1st Qu.:15.43   1st Qu.: 96.5   1st Qu.:2.581  
 Median :19.20   Median :123.0   Median :3.325  
 Mean   :20.09   Mean   :146.7   Mean   :3.217  
 3rd Qu.:22.80   3rd Qu.:180.0   3rd Qu.:3.610  
 Max.   :33.90   Max.   :335.0   Max.   :5.424  
Measures of center

  • Mean — average
  • Median — middle value
  • Mode — most frequent
x <- mtcars$mpg
c(mean = mean(x),
  median = median(x),
  sd = sd(x))
     mean    median        sd 
20.090625 19.200000  6.026948 

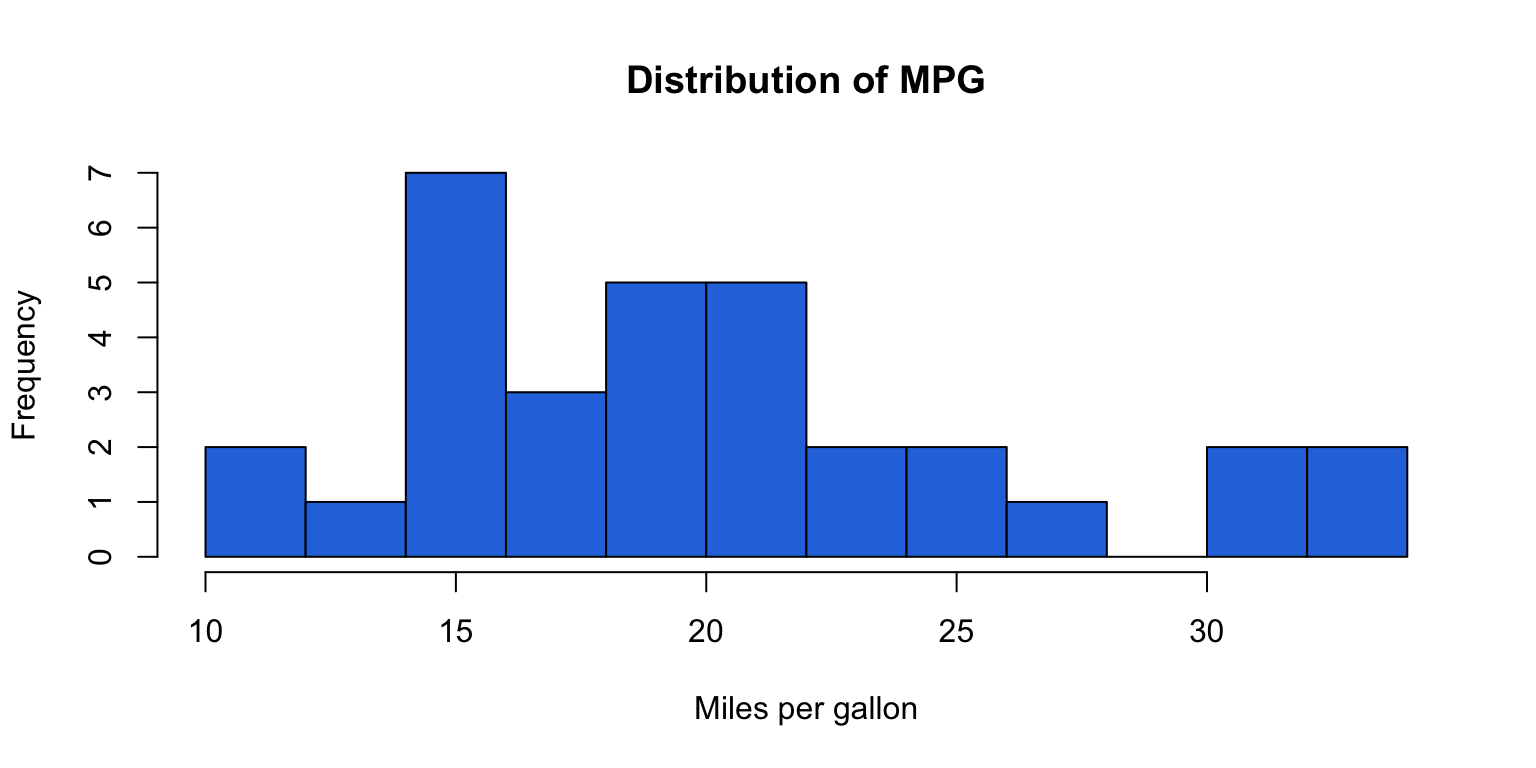
Visualizing a distribution

hist(mtcars$mpg,
     breaks = 10,
     col = "#2a76dd",
     main = "Distribution of MPG",
     xlab = "Miles per gallon")

Summary

  • Statistics turns data into decisions
  • Center and spread are the first summaries
  • Always visualize before you model