# Create comprehensive comparison table
all_criteria <- data.frame(
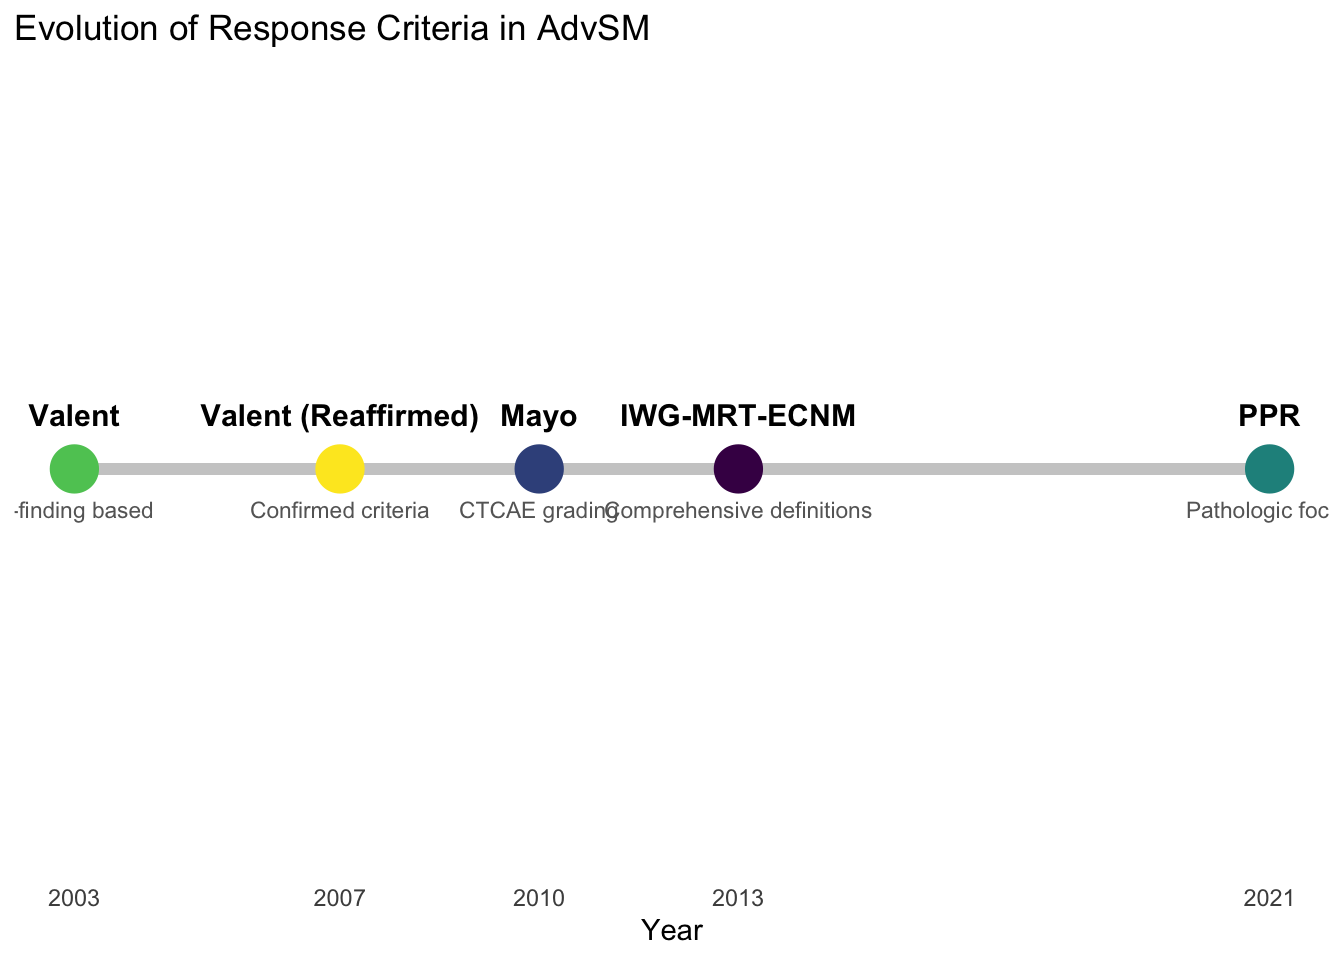
  Criteria = c("Valent (2003)", "Mayo (2010)", "IWG-MRT-ECNM (2013)", "PPR (2021)"),
  `Primary Focus` = c("C-finding reversal", "4 domains (A-D)",
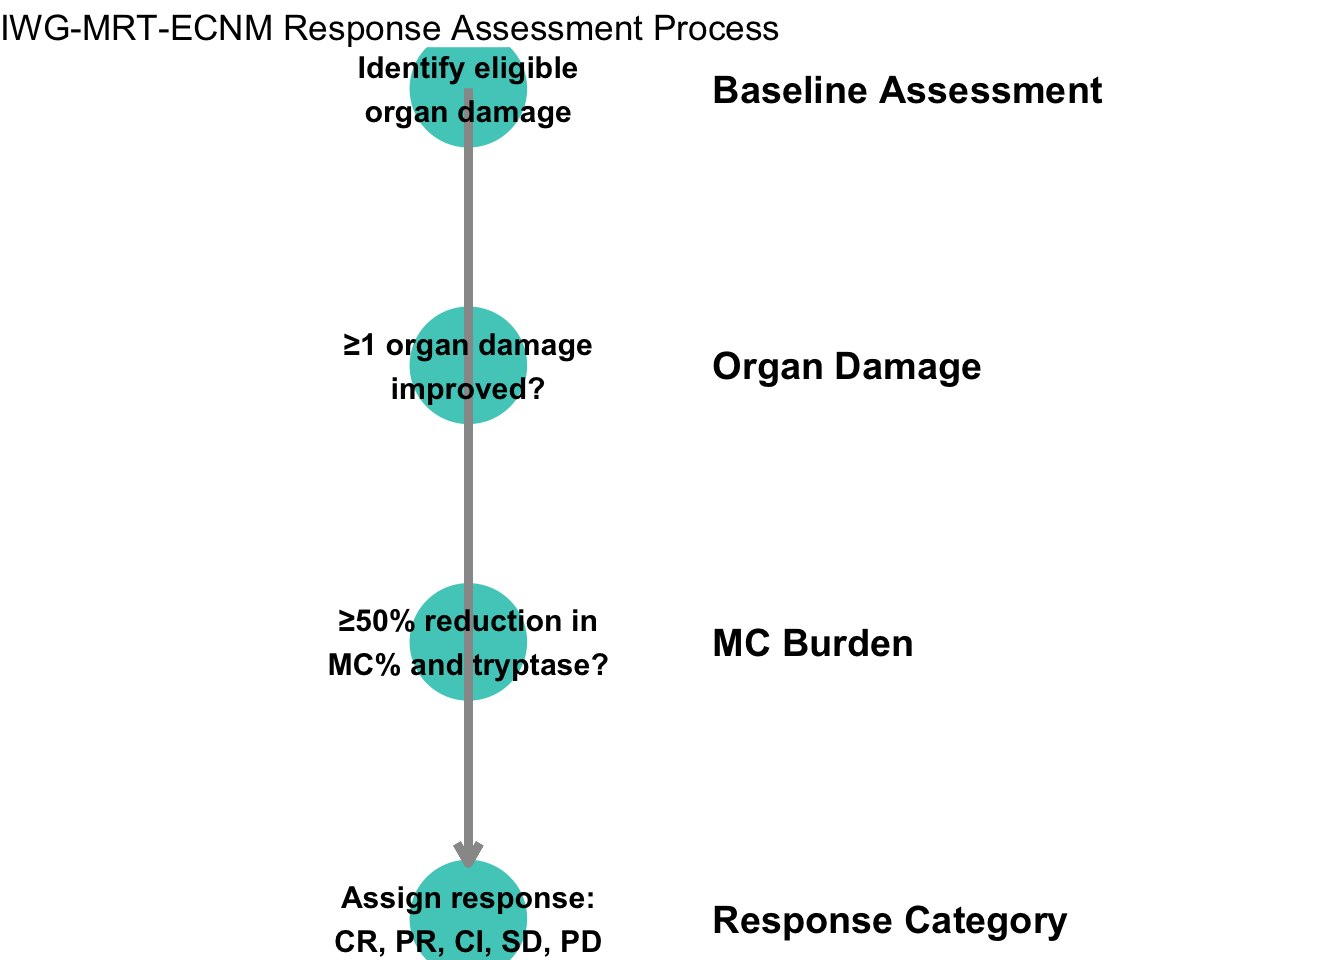
                      "Organ damage normalization", "Mast cell burden only"),
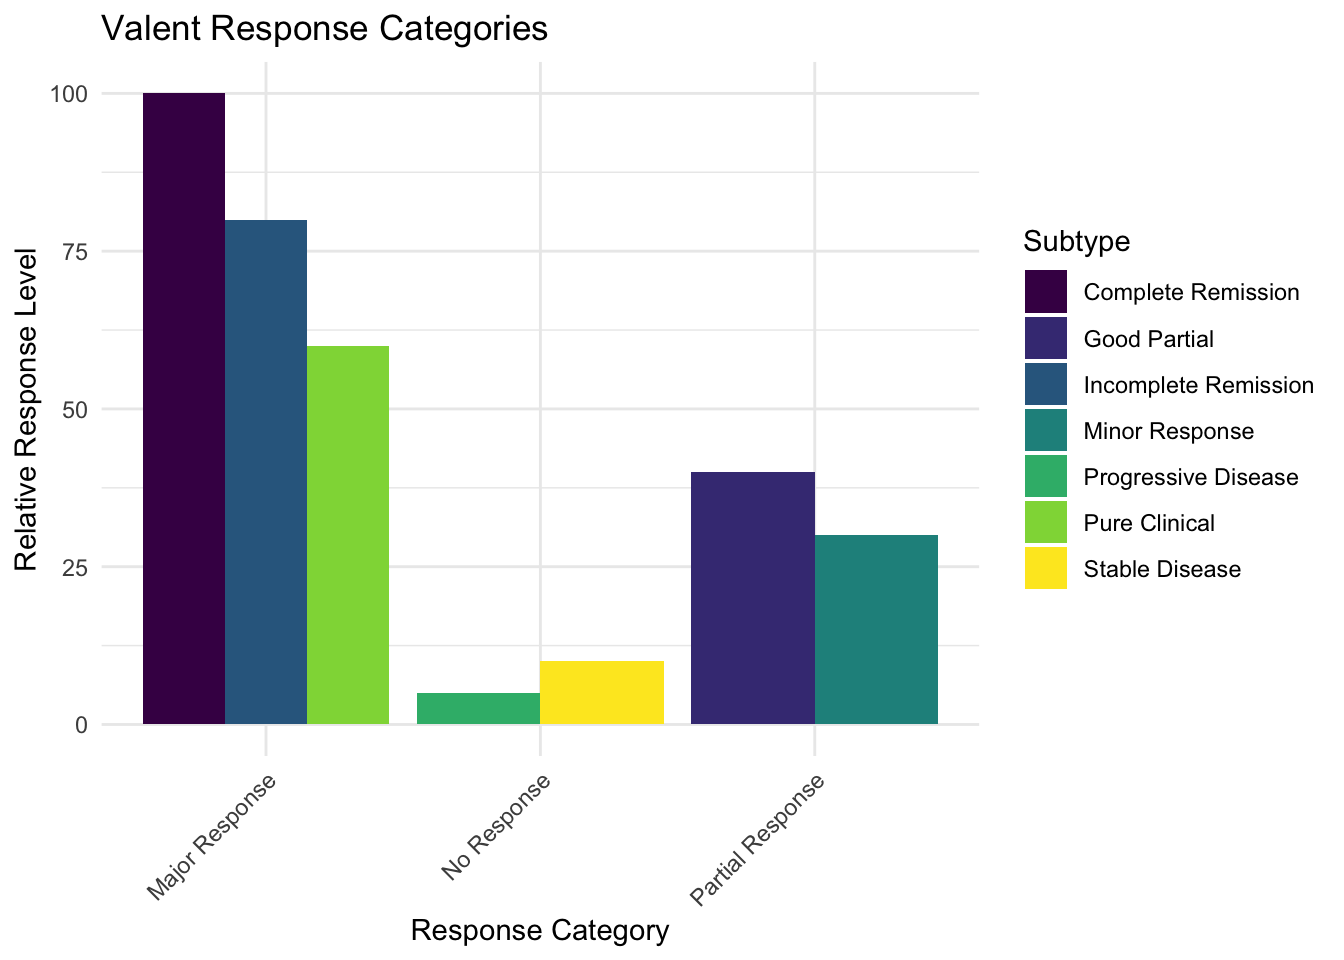
  `Response Categories` = c("MR, PR, NR", "CR, MR, PR, SD, PD",
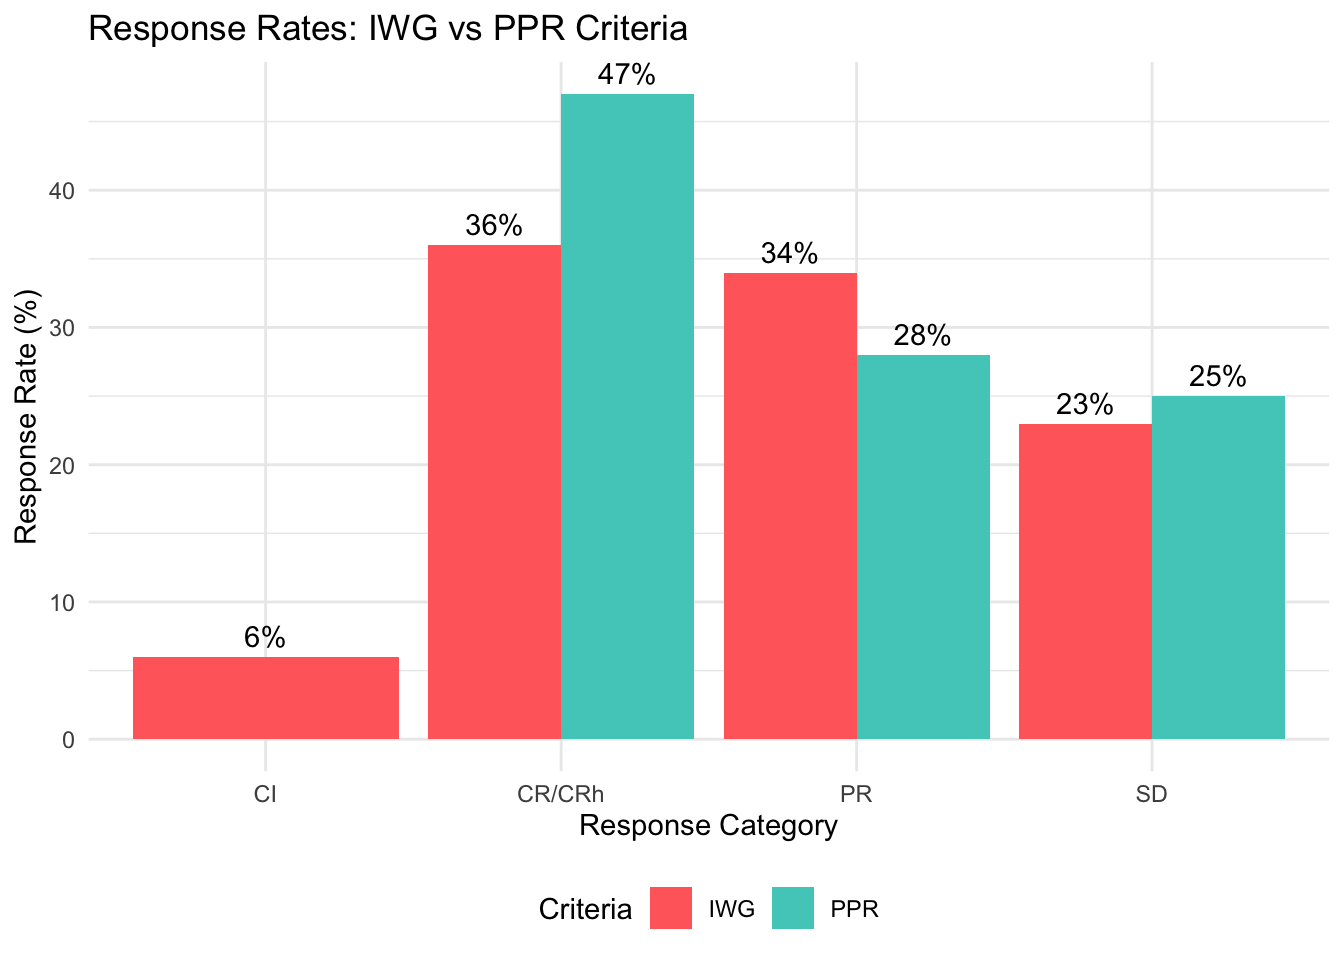
                           "CR, PR, CI, SD, PD", "CR/CRh, PR, SD, PD"),
  `Duration Required` = c("Not specified", "4 weeks", "12 weeks", "Not specified"),
  `Strengths` = c("Simple, historically important",
                  "Detailed organ damage criteria",
                  "Comprehensive, regulatory accepted",
                  "Focuses on disease biology"),
  `Limitations` = c("Subjective, incomplete definitions",
                   "Complex, excludes SM-AHN",
                   "Confounded by comorbidities",
                   "Does not capture clinical benefit"),
  check.names = FALSE
)

# Create interactive table
datatable(all_criteria,
          options = list(
            pageLength = 5,
            scrollX = TRUE,
            columnDefs = list(
              list(width = '150px', targets = 0),
              list(width = '200px', targets = 1:5)
            )
          ),
          class = 'cell-border stripe hover',
          rownames = FALSE) %>%
  formatStyle(columns = 1, fontWeight = 'bold') %>%
  formatStyle(columns = 2:6, fontSize = '12px')