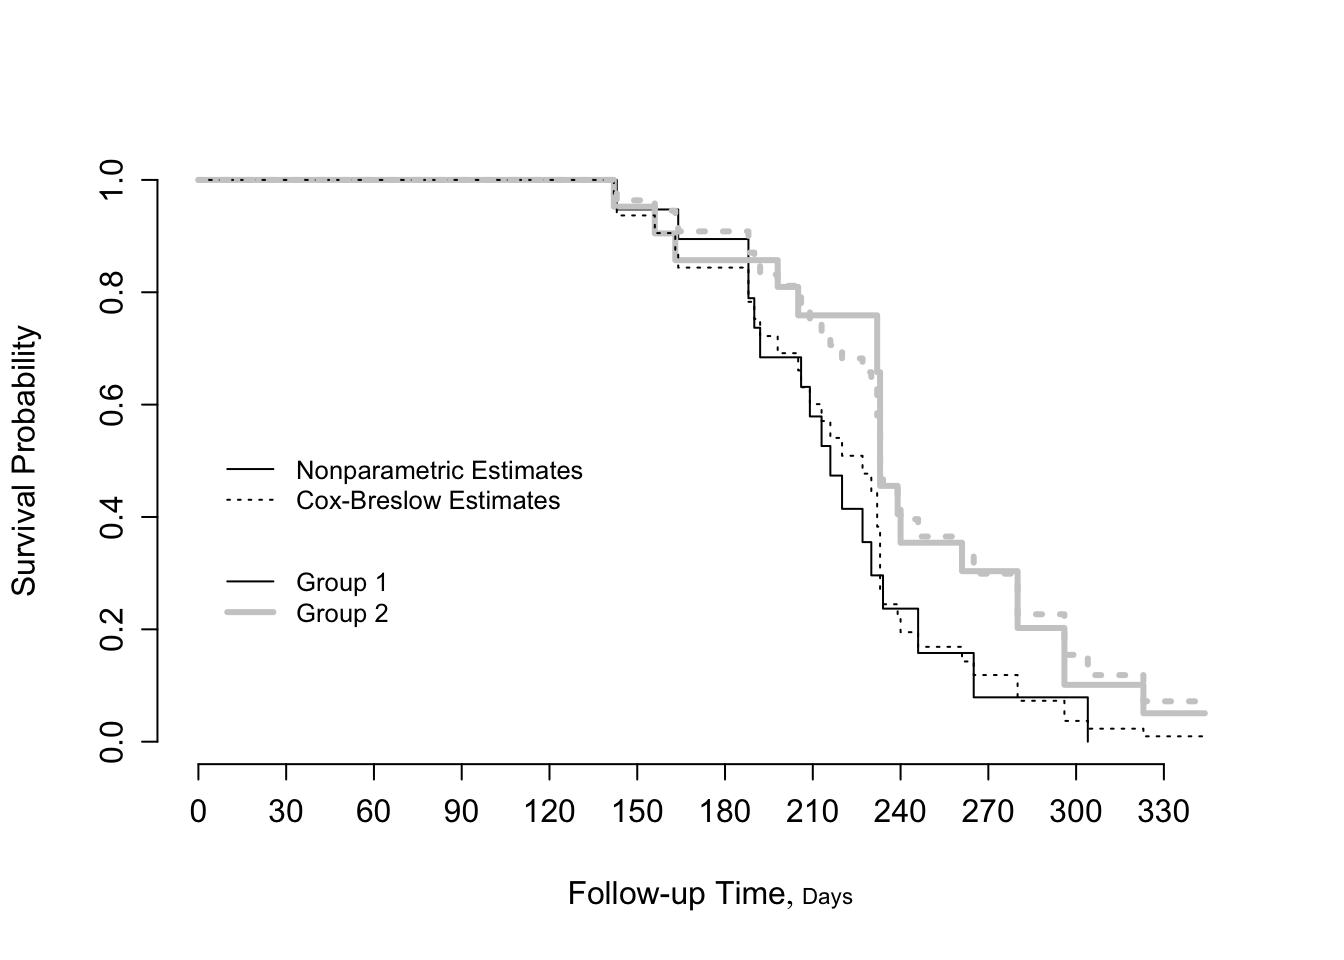
require(rms)Loading required package: rmsLoading required package: Hmisc
Attaching package: 'Hmisc'The following objects are masked from 'package:base':
format.pval, unitsoptions(prType='html')
group <- c(rep('Group 1',19),rep('Group 2',21))
group <- factor(group)
dd <- datadist(group); options(datadist='dd')
days <-
c(143,164,188,188,190,192,206,209,213,216,220,227,230,
234,246,265,304,216,244,142,156,163,198,205,232,232,
233,233,233,233,239,240,261,280,280,296,296,323,204,344)
death <- rep(1,40)
death[c(18,19,39,40)] <- 0
units(days) <- 'Day'
df <- data.frame(days, death, group)
S <- Surv(days, death)
f <- npsurv(S ~ group, type='fleming')
for(meth in c('exact', 'breslow', 'efron')) {
g <- cph(S ~ group, method=meth, surv=TRUE, x=TRUE, y=TRUE)
# print(g) to see results
}
f.exp <- psm(S ~ group, dist='exponential')
fw <- psm(S ~ group, dist='weibull')
phform <- pphsm(fw)Warning in pphsm(fw): at present, pphsm does not return the correct covariance
matrixco <- gray(c(0, .8))
survplot(f, lty=c(1, 1), lwd=c(1, 3), col=co,
label.curves=FALSE, conf='none')
survplot(g, lty=c(3, 3), lwd=c(1, 3), col=co, # Efron approx.
add=TRUE, label.curves=FALSE, conf.type='none')
legend(c(2, 160), c(.38, .54),
c('Nonparametric Estimates', 'Cox-Breslow Estimates'),
lty=c(1, 3), cex=.8, bty='n')
legend(c(2, 160), c(.18, .34), cex=.8,
c('Group 1', 'Group 2'), lwd=c(1,3), col=co, bty='n')