---
title: "Selinexor in MF"
subtitle: "Comprehensive Topline Results Analysis — Addressing Key Clinical Questions"
author: "Ashwin Kishtagari, MD — Vanderbilt University Medical Center"
date: "2026-04-01"
format:
html:
toc: true
toc-depth: 3
toc-location: right
code-fold: true
code-summary: "Show code"
theme:
light: journal
fig-width: 9
fig-height: 6
smooth-scroll: true
highlight-style: github
execute:
echo: true
warning: false
message: false
---
```{r setup}
#| label: setup
#| include: false
library(tidyverse)
library(gt)
library(gtExtras)
library(scales)
library(patchwork)
# ── Custom gt theme ──────────────────────────────────────────────────────────
my_gt_theme <- function(gt_tbl) {
gt_tbl |>
tab_options(
table.font.size = px(13),
heading.title.font.size = px(17),
heading.subtitle.font.size = px(13),
heading.align = "left",
column_labels.font.weight = "bold",
column_labels.background.color = "#1a3a5c",
table.border.top.style = "none",
table_body.hlines.color = "#E0E0E0",
table_body.border.bottom.color = "#1a3a5c",
table_body.border.bottom.width = px(2),
data_row.padding = px(7)
) |>
opt_row_striping() |>
tab_style(
style = cell_text(color = "white"),
locations = cells_column_labels()
)
}
# ── Color palette ────────────────────────────────────────────────────────────
pal <- list(
sel = "#e67e22",
rux = "#2c3e50",
pbo = "#95a5a6",
pela = "#5c6bc0",
green = "#27ae60",
red = "#c0392b",
warn = "#f39c12",
light = "#ecf0f1"
)
```
# Executive Summary {#executive-summary}
::: callout-important
## SENTRY Phase 3 Topline Results — Key Takeaways
The Phase 3 SENTRY trial (NCT04562389) of **selinexor 60 mg weekly + ruxolitinib** versus **placebo + ruxolitinib** in 353 JAK-inhibitor–naïve myelofibrosis patients reported topline results on March 24, 2026:
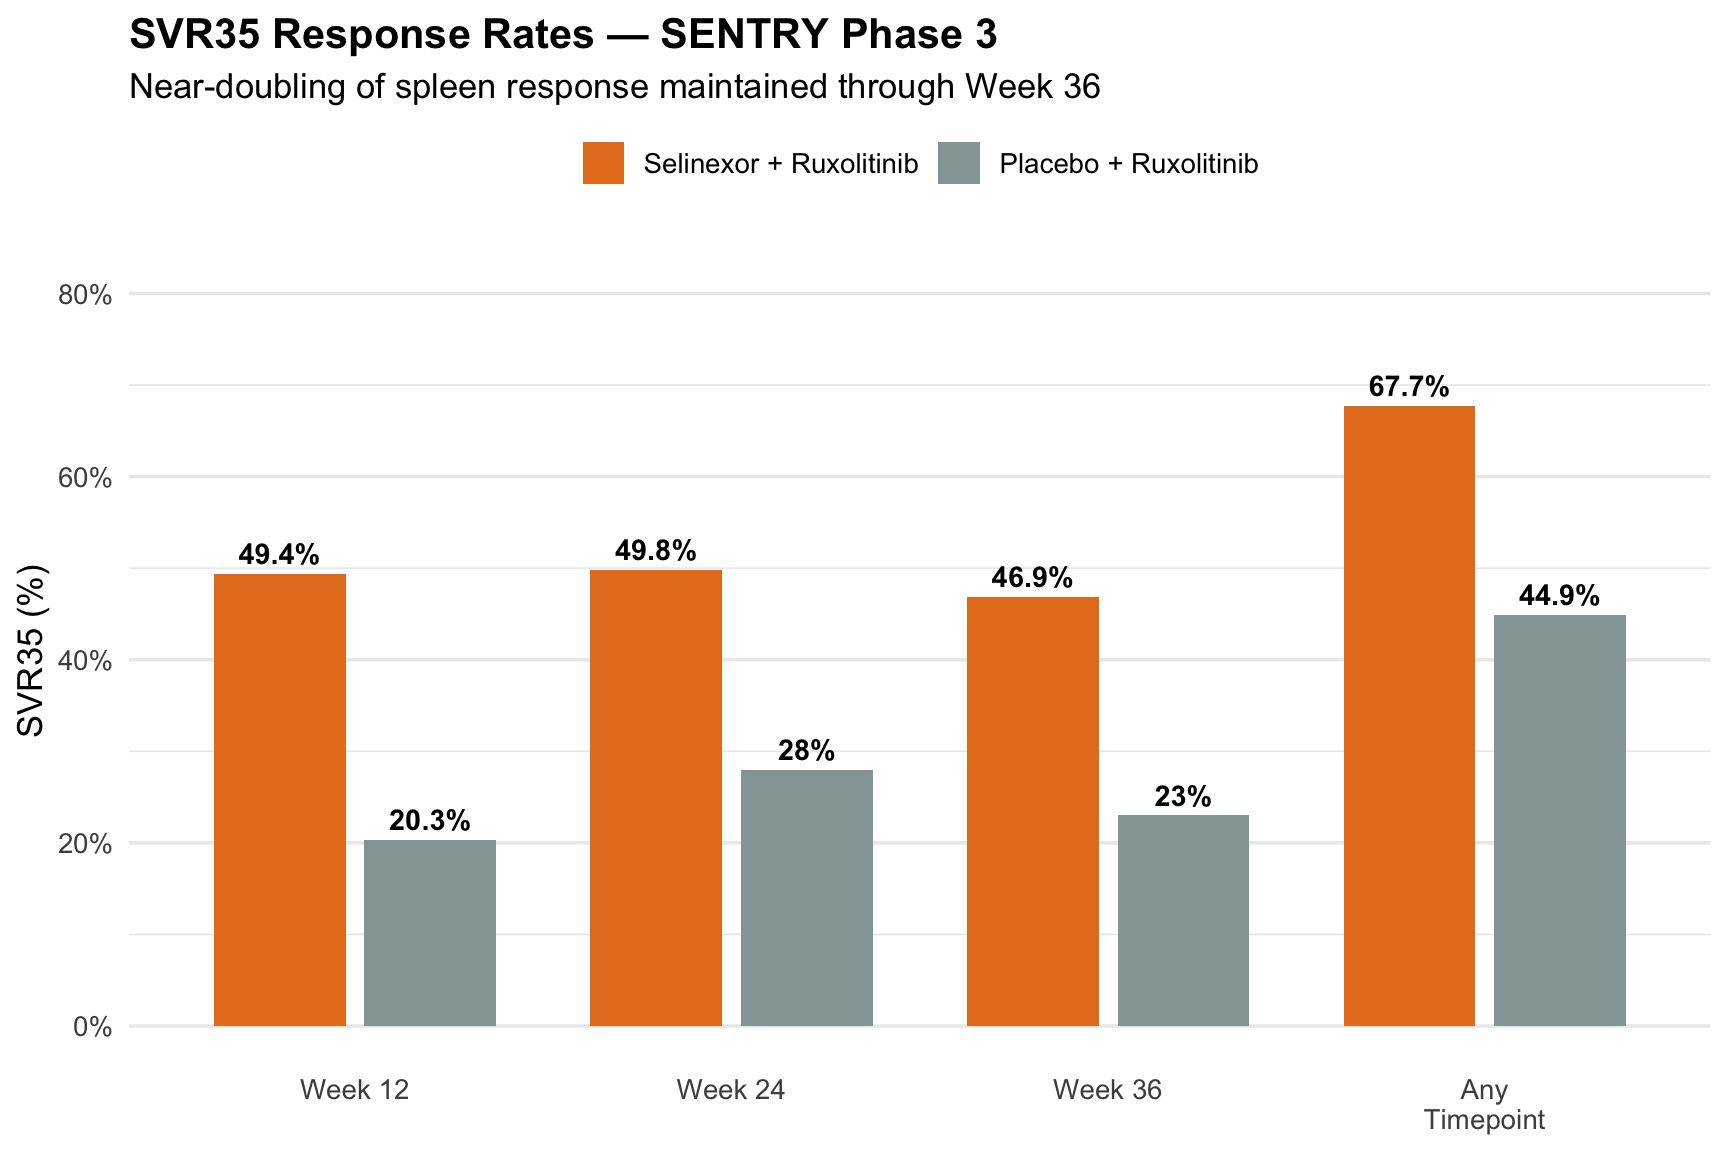
- **SVR35 at Week 24 (co-primary): MET** — 49.8% vs. 28.0% (OR 2.58; p \< 0.0001)
- **Abs-TSS at Week 24 (co-primary): NOT MET** — −9.89 vs. −10.86 (p = 0.82)
- **Overall survival (secondary): Nominally significant** — HR 0.43 (95% CI 0.19–1.00; p = 0.0222)
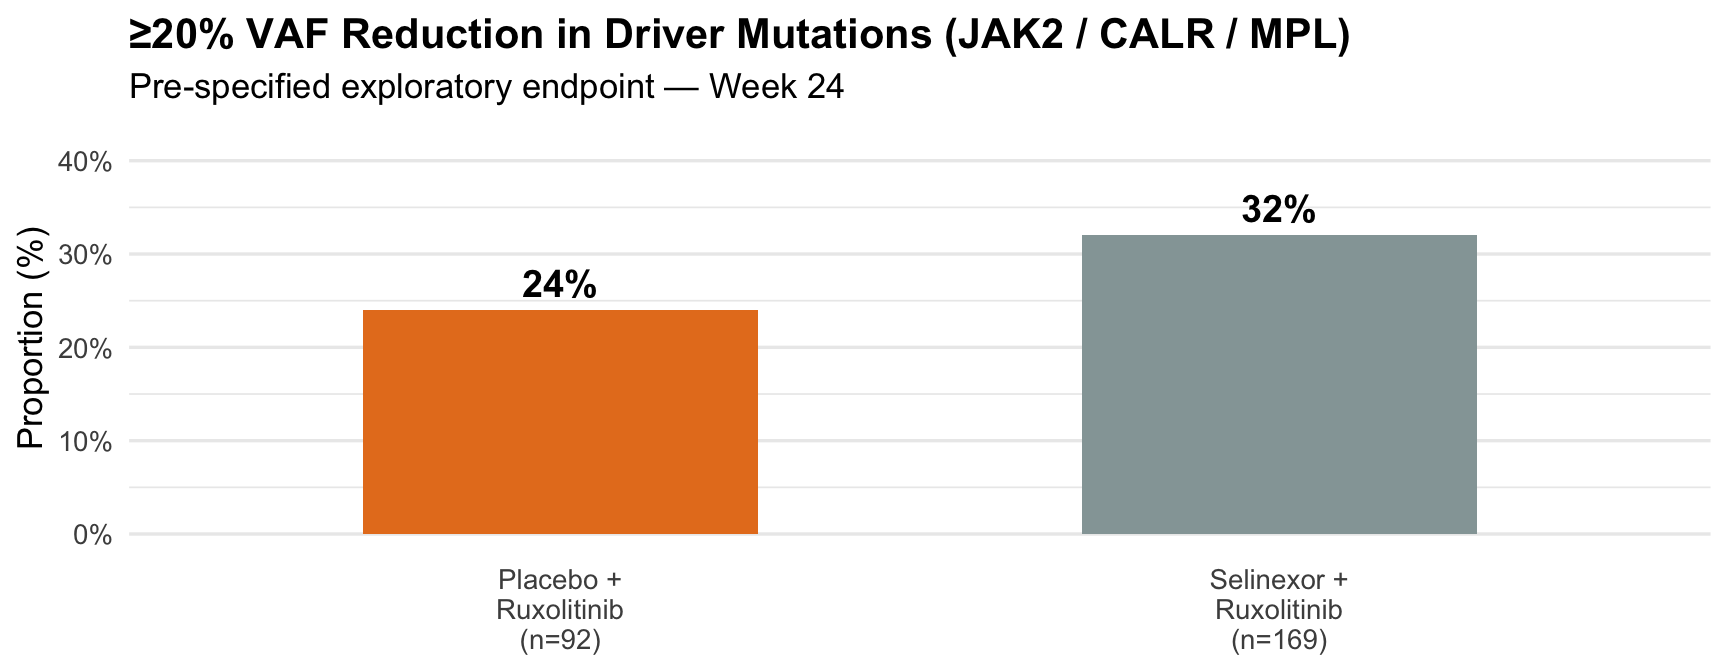
- **VAF reduction ≥20% (exploratory):** 32% vs. 24%
- **Safety:** Consistent with known profiles; Grade ≥3 TEAEs 70.1% vs. 50.0%
:::
# Trial Design
```{r trial-design}
#| label: trial-design
design <- tibble(
  Parameter = c(
    "Trial Name / NCT", "Phase", "Design",
    "Patients Enrolled (N)", "Randomization",
    "Treatment Arm", "Control Arm",
    "Platelet Eligibility", "Co-Primary Endpoint 1",
    "Co-Primary Endpoint 2", "Key Secondary Endpoints",
    "Stratification Factors",
    "Data Cutoff"
  ),
  Detail = c(
    "SENTRY / XPORT-MF-034 (NCT04562389)", "Phase 3",
    "Randomized, double-blind, placebo-controlled, multicenter",
    "353", "2:1 (selinexor + rux : placebo + rux)",
    "Ruxolitinib BID + Selinexor 60 mg QW (28-day cycles)",
    "Ruxolitinib BID + Placebo",
    "Platelets ≥100 × 10⁹/L",
    "SVR35 at Week 24 (≥35% spleen volume reduction by MRI/CT)",
    "Absolute TSS change at Week 24 (MFSAF v4.0, excluding fatigue)",
    "PFS, OS, Hgb stabilization, VAF reduction, BM fibrosis, cytokines",
    "DIPSS risk (Int-1 vs. Int-2/High); Spleen volume (<1800 vs. ≥1800 cm³); Platelets (100–200 vs. >200 × 10⁹/L)",
    "February 20, 2026"
  )
)

design |>
  gt() |>
  tab_header(
    title = md("**SENTRY Trial Design Overview**"),
    subtitle = "Phase 3 Selinexor + Ruxolitinib in JAKi-Naïve Myelofibrosis"
  ) |>
  cols_label(Parameter = "Parameter", Detail = "Detail") |>
  cols_width(Parameter ~ px(220), Detail ~ px(520)) |>
  my_gt_theme()
```
::: callout-note
## Statistical Design Details
- Both co-primary endpoints powered at \>80%
- SVR35 assumption: 40% for ruxolitinib, 70% for selinexor + ruxolitinib
- Abs-TSS assumption: \>4-point delta with SD of 12 for both arms
- Co-primary endpoints tested sequentially (SVR35 first, then Abs-TSS)
:::
# Efficacy Results
## Co-Primary Endpoint 1: SVR35
```{r svr35-primary}
#| label: svr35-primary
svr_primary <- tibble(
  Measure = c(
    "SVR35 at Week 24, n (%)",
    "Exact 95% CI",
    "Difference (Sel+Rux − Pbo+Rux)",
    "95% CI of Difference",
    "Odds Ratio (95% CI)",
    "One-Sided P-value (CMH)"
  ),
  `Selinexor + Ruxolitinib (N=235)` = c(
    "117 (49.8%)", "(43.2, 56.4)", "21.82%", "(11.50, 32.14)",
    "2.58 (1.60, 4.17)", ""
  ),
  `Placebo + Ruxolitinib (N=118)` = c(
    "33 (28.0%)", "(20.1, 37.0)", "", "", "", "< 0.0001"
  )
)

svr_primary |>
  gt() |>
  tab_header(
    title = md("**Co-Primary Endpoint: SVR35 at Week 24**"),
    subtitle = "Statistically Significant — Near-Doubling Over Ruxolitinib Alone"
  ) |>
  tab_style(
    style = list(cell_fill(color = "#d5f5e3"), cell_text(weight = "bold")),
    locations = cells_body(rows = 1)
  ) |>
  tab_style(
    style = list(cell_fill(color = "#d5f5e3"), cell_text(weight = "bold")),
    locations = cells_body(rows = 6)
  ) |>
  tab_footnote(
    footnote = "CMH = Cochran-Mantel-Haenszel test stratified by randomization factors. Data cutoff: 2026-02-20.",
    locations = cells_title(groups = "subtitle")
  ) |>
  my_gt_theme()
```
### SVR35 Over Time
```{r svr35-longitudinal}
#| label: svr35-longitudinal
svr_time <- tibble(
  Timepoint = c("Week 12", "Week 24", "Week 36", "Any Timepoint"),
  Sel_n = c(116, 117, 97, 159),
  Sel_N = c(235, 235, 207, 235),
  Pbo_n = c(24, 33, 23, 53),
  Pbo_N = c(118, 118, 100, 118)
) |>
  mutate(Sel_pct = Sel_n / Sel_N * 100, Pbo_pct = Pbo_n / Pbo_N * 100)

svr_time |>
  transmute(
    Timepoint,
    `Sel+Rux` = paste0(Sel_n, "/", Sel_N, " (", sprintf("%.1f%%", Sel_pct), ")"),
    `Pbo+Rux` = paste0(Pbo_n, "/", Pbo_N, " (", sprintf("%.1f%%", Pbo_pct), ")")
  ) |>
  gt() |>
  tab_header(
    title = md("**SVR35 Response Over Time**"),
    subtitle = "Rapid onset by Week 12 with sustained response through Week 36"
  ) |>
  my_gt_theme()
```
```{r svr35-barplot}
#| label: svr35-barplot
#| fig-cap: "SVR35 Response Rates Over Time — Selinexor + Ruxolitinib vs. Placebo + Ruxolitinib"
svr_plot_data <- tibble(
  Timepoint = rep(c("Week 12", "Week 24", "Week 36", "Any\nTimepoint"), 2),
  Arm       = rep(c("Selinexor + Ruxolitinib", "Placebo + Ruxolitinib"), each = 4),
  Pct       = c(49.4, 49.8, 46.9, 67.7,   20.3, 28.0, 23.0, 44.9)
) |>
  mutate(
    Timepoint = factor(Timepoint, levels = c("Week 12", "Week 24", "Week 36", "Any\nTimepoint")),
    Arm = factor(Arm, levels = c("Selinexor + Ruxolitinib", "Placebo + Ruxolitinib"))
  )

ggplot(svr_plot_data, aes(x = Timepoint, y = Pct, fill = Arm)) +
  geom_col(position = position_dodge(0.8), width = 0.7) +
  geom_text(aes(label = paste0(round(Pct, 1), "%")),
            position = position_dodge(0.8), vjust = -0.5,
            fontface = "bold", size = 3.8) +
  scale_fill_manual(values = c("Selinexor + Ruxolitinib" = pal$sel,
                                "Placebo + Ruxolitinib"   = pal$pbo)) +
  scale_y_continuous(limits = c(0, 82), breaks = seq(0, 80, 20),
                     labels = function(x) paste0(x, "%")) +
  labs(title = "SVR35 Response Rates — SENTRY Phase 3",
       subtitle = "Near-doubling of spleen response maintained through Week 36",
       x = NULL, y = "SVR35 (%)", fill = NULL) +
  theme_minimal(base_size = 13) +
  theme(legend.position = "top", plot.title = element_text(face = "bold"),
        panel.grid.major.x = element_blank())
```
## Co-Primary Endpoint 2: Absolute TSS Change
```{r tss-table}
#| label: tss-table
tss_data <- tibble(
  Measure = c(
    "Baseline n", "Baseline Median TSS", "Baseline Mean TSS (SD)",
    "Adjusted Abs Mean Change at Wk 24 (95% CI)",
    "Adjusted Mean Difference (95% CI)",
    "One-Sided P-value"
  ),
  `Selinexor + Ruxolitinib (N=235)` = c(
    "235", "21.71", "22.74 (11.88)",
    "−9.89 (−11.19, −8.59)", "", ""
  ),
  `Placebo + Ruxolitinib (N=118)` = c(
    "117", "19.57", "22.23 (13.03)",
    "−10.86 (−12.58, −9.14)", "0.97 (−1.07, 3.02)", "0.8246"
  )
)

tss_data |>
  gt() |>
  tab_header(
    title = md("**Co-Primary Endpoint: Absolute TSS Change at Week 24**"),
    subtitle = md("**NOT MET** — Similar symptom improvement in both arms")
  ) |>
  tab_style(
    style = list(cell_fill(color = "#fadbd8"), cell_text(weight = "bold")),
    locations = cells_body(rows = 6)
  ) |>
  tab_footnote(
    footnote = "TSS = sum of 6 MFSAF v4.0 symptoms (excluding fatigue); range 0–60. MMRM adjusted for stratification factors, sex, and baseline TSS.",
    locations = cells_title(groups = "subtitle")
  ) |>
  my_gt_theme()
```
## Overall Survival & VAF Reduction
```{r os-vaf-tables}
#| label: os-vaf-tables
os_data <- tibble(
  Measure = c("Deaths, n (%)", "Median OS Follow-up (months, 95% CI)",
              "Hazard Ratio (95% CI)", "Nominal P-value (log-rank)"),
  `Selinexor + Rux (N=235)` = c("11 (4.7%)", "11.56 (10.71, 13.01)", "0.43 (0.19, 1.00)", ""),
  `Placebo + Rux (N=118)` = c("12 (10.2%)", "12.58 (10.61, 13.93)", "", "0.0222")
)

os_data |>
  gt() |>
  tab_header(title = md("**Secondary Endpoint: Overall Survival**"),
             subtitle = "Nominally Significant — >50% Reduction in Risk of Death") |>
  tab_style(style = list(cell_fill(color = "#d5f5e3"), cell_text(weight = "bold")),
            locations = cells_body(rows = 3)) |>
  my_gt_theme()
```
# Safety Profile
```{r safety-table}
#| label: safety-table
safety <- tibble(
  `Adverse Event` = c("Thrombocytopenia (any)", "Anemia (any)", "Nausea (any)",
                      "Constipation (any)", "Neutropenia (any)", "Grade ≥3 TEAEs",
                      "TEAEs → Discontinuation", "Leukemic Transformation"),
  `Sel + Rux (N=234)` = c("139 (59.4%)", "134 (57.3%)", "134 (57.3%)", "74 (31.6%)",
                           "63 (26.9%)", "164 (70.1%)", "34 (14.5%)", "1.7%"),
  `Pbo + Rux (N=116)` = c("50 (43.1%)", "67 (57.8%)", "20 (17.2%)", "42 (36.2%)",
                           "10 (8.6%)", "58 (50.0%)", "10 (8.6%)", "1.7%")
)

safety |>
  gt() |>
  tab_header(title = md("**Safety and Tolerability — SENTRY Phase 3**"),
             subtitle = "Five Most Common TEAEs in the Combination Arm") |>
  tab_style(style = cell_fill(color = "#fdebd0"),
            locations = cells_body(rows = `Adverse Event` == "Grade ≥3 TEAEs")) |>
  tab_style(style = cell_fill(color = "#fadbd8"),
            locations = cells_body(rows = `Adverse Event` == "TEAEs → Discontinuation")) |>
  tab_style(style = cell_fill(color = "#d5f5e3"),
            locations = cells_body(rows = `Adverse Event` == "Leukemic Transformation")) |>
  my_gt_theme()
```
# Clinical Analysis: Addressing Key Questions
## Q1: Initial Thoughts on the Topline Data
The SENTRY trial delivered a **mixed but clinically meaningful result**. The study met one of two co-primary endpoints with a robust SVR35 signal, but completely missed on symptoms. Key observations:
- **The SVR35 result is unambiguously positive.** A near-doubling (49.8% vs. 28.0%, p \< 0.0001) is statistically robust and clinically meaningful by any standard in MF
- **The TSS failure is not just a miss — it's a non-signal.** The adjusted mean difference of +0.97 (favoring the control arm) with p = 0.82 shows no trend whatsoever toward symptom improvement. This is worse than MANIFEST-2's near-miss (p = 0.055)
- **The OS and VAF signals add important secondary dimensions** that need maturation but provide biological plausibility for the spleen response benefit
- **Safety is consistent with expectations** — no new signals, but the burden is real (70% Grade ≥3, 57% nausea)
As Dr. Rampal noted in the investigator call, the kinetics of response are particularly compelling: the 49% SVR35 threshold was achieved by Week 12, with only slight deepening in the ruxolitinib arm to 28% by Week 24. This rapid onset is a genuine clinical advantage.
## Q2: How Significant and Competitive Is the SVR35 Improvement?
```{r benchmark-svr35}
#| label: benchmark-svr35
#| fig-cap: "SVR35 at Week 24 Across Frontline MF Trials"
#| fig-height: 5.5
benchmark <- tibble(
  Trial = c("PERSIST-1\nPacritinib", "Simplify-1\nMomelotinib",
            "SENTRY\nPbo+Rux arm", "MANIFEST-2\nPbo+Rux arm",
            "JAKARTA\nFedratinib", "COMFORT-I\nRuxolitinib",
            "SENTRY\nSel+Rux", "MANIFEST-2\nPela+Rux"),
  SVR35 = c(19, 26.5, 28.0, 35.2, 36.5, 41.9, 49.8, 65.9),
  Category = c("JAKi Mono", "JAKi Mono", "Control Arm", "Control Arm",
               "JAKi Mono", "JAKi Mono", "Selinexor Combo", "BET-i Combo")
) |> mutate(Trial = factor(Trial, levels = Trial))

ggplot(benchmark, aes(x = Trial, y = SVR35, fill = Category)) +
  geom_col(width = 0.7) +
  geom_text(aes(label = paste0(SVR35, "%")), vjust = -0.4, fontface = "bold", size = 3.8) +
  geom_hline(yintercept = 50, linetype = "dashed", color = pal$red, linewidth = 0.8) +
  annotate("text", x = 2, y = 53, label = "50% competitive threshold",
           color = pal$red, fontface = "italic", size = 3.2) +
  scale_fill_manual(values = c("JAKi Mono" = pal$pbo, "Control Arm" = "#bdc3c7",
                                "Selinexor Combo" = pal$sel, "BET-i Combo" = pal$pela)) +
  scale_y_continuous(limits = c(0, 78), labels = function(x) paste0(x, "%")) +
  labs(title = "SVR35 at Week 24 — Cross-Trial Comparison",
       subtitle = "Frontline MF trials (indirect comparison; populations differ)",
       x = NULL, y = "SVR35 (%)", fill = NULL) +
  theme_minimal(base_size = 12) +
  theme(legend.position = "top", plot.title = element_text(face = "bold"),
        axis.text.x = element_text(size = 9, lineheight = 1.1),
        panel.grid.major.x = element_blank())
```
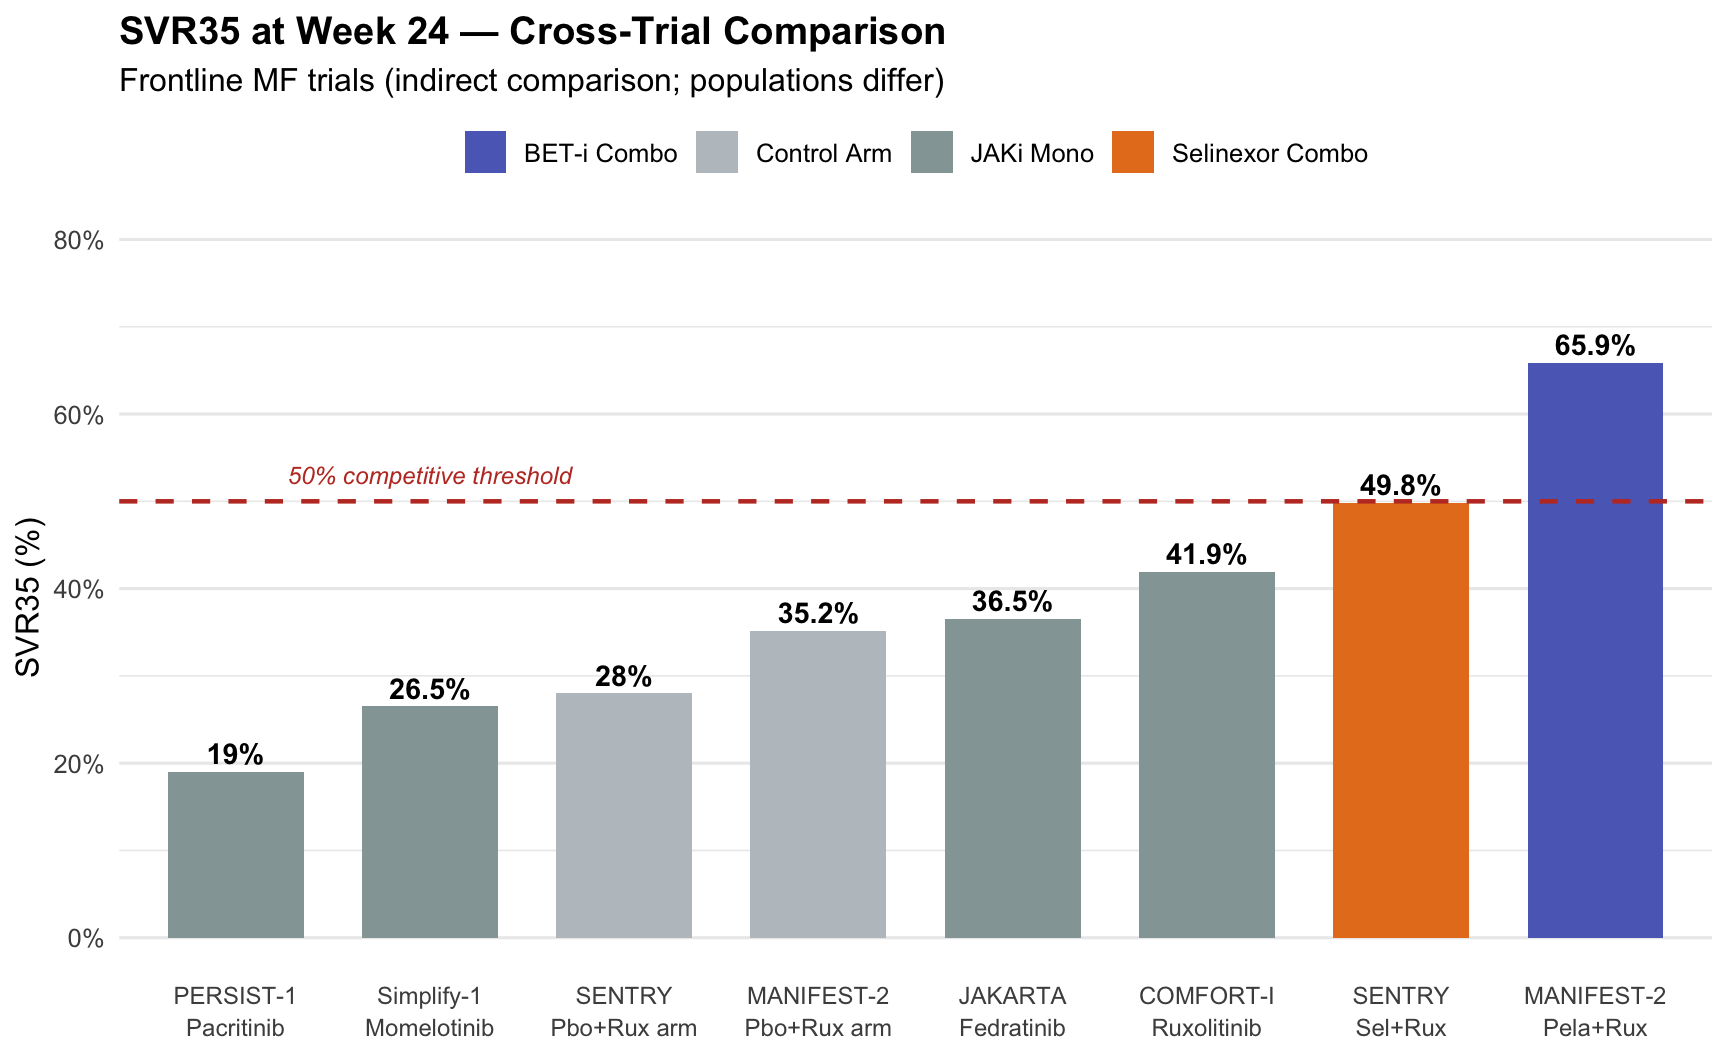
**The SVR35 improvement is significant but needs contextualization:**
- The **absolute rate of 49.8%** is respectable but falls below the 65.9% achieved by pelabresib + ruxolitinib in MANIFEST-2
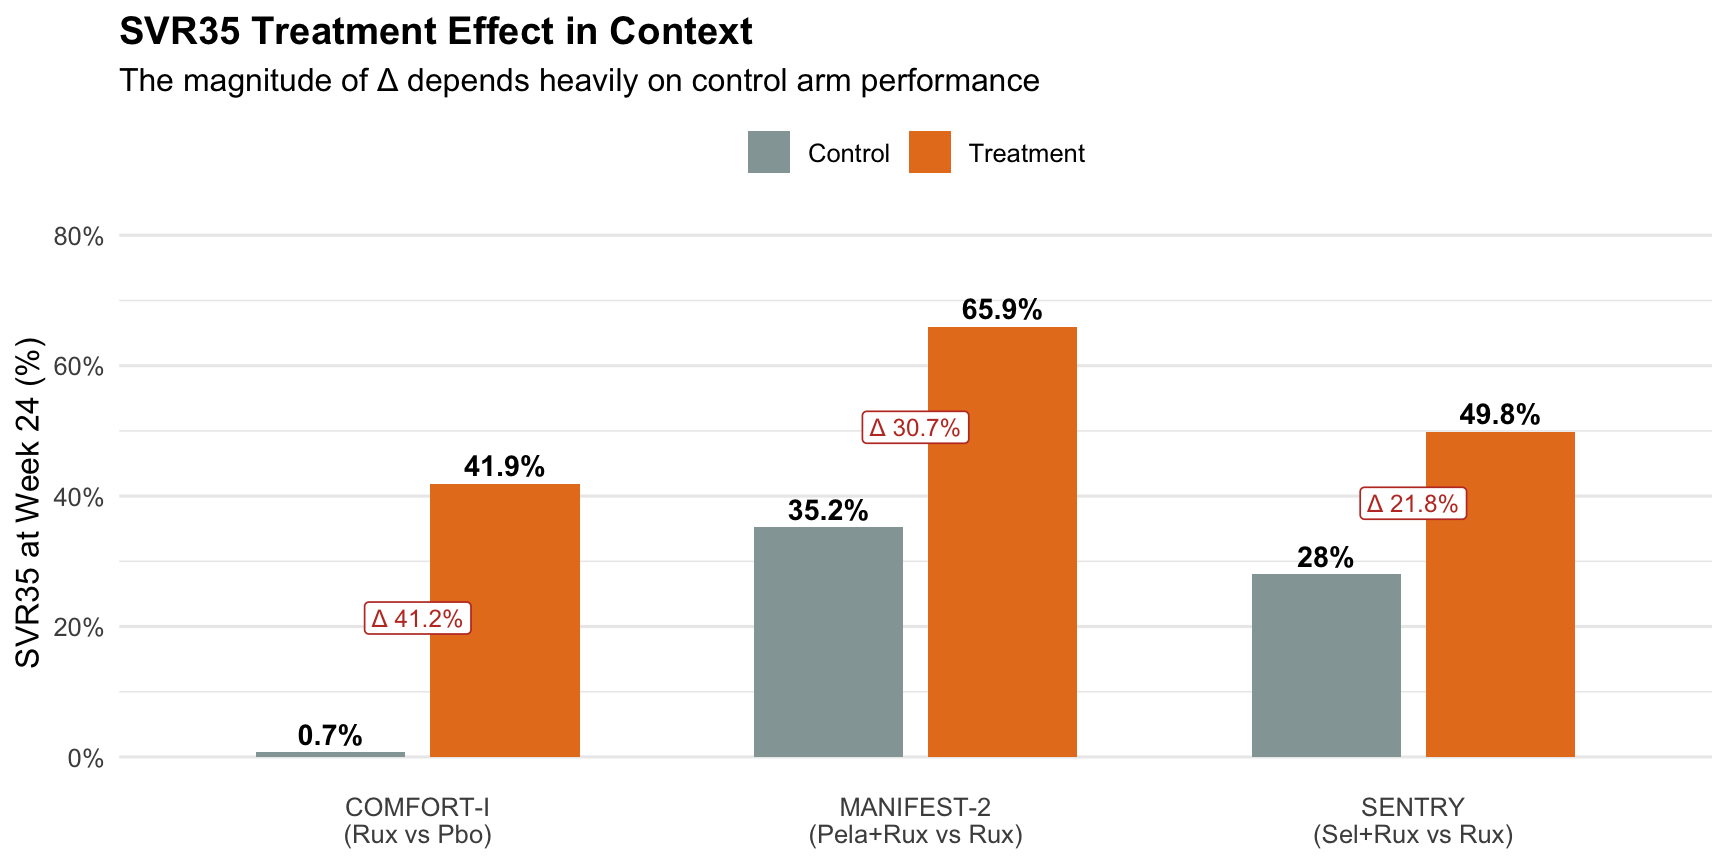
- The **control arm SVR35 of 28%** is notably lower than COMFORT-I's 41.9% and MANIFEST-2's 35.2%. During the investigator call, Dr. Rampal addressed this directly, noting that ruxolitinib SVR35 rates across Phase 3 trials have ranged from the "high twenties to high thirties" and that the SENTRY control arm is within historical parameters
- The **treatment effect delta of 21.8 percentage points** is clinically meaningful, though the lower control arm partially inflates this relative difference
- **Rapidity** is a genuine differentiator: 49% SVR35 at Week 12 (vs. 20% control), and the response was **sustained at Week 36** (47% vs. 23%)
- At **any timepoint**, 67.7% of combination patients achieved SVR35 vs. 44.9% with ruxolitinib alone
```{r context-plot}
#| label: context-plot
#| fig-cap: "Treatment Effect in Context — Control Arm Performance Matters"
#| fig-height: 4.5
context_data <- tibble(
  Trial = c("COMFORT-I\n(Rux vs Pbo)", "MANIFEST-2\n(Pela+Rux vs Rux)", "SENTRY\n(Sel+Rux vs Rux)"),
  Combo = c(41.9, 65.9, 49.8), Control = c(0.7, 35.2, 28.0)
) |> mutate(Delta = Combo - Control, Trial = factor(Trial, levels = Trial))

ctx_long <- context_data |>
  pivot_longer(cols = c(Combo, Control), names_to = "Arm", values_to = "SVR35") |>
  mutate(Arm = ifelse(Arm == "Combo", "Treatment", "Control"))

ggplot(ctx_long, aes(x = Trial, y = SVR35, fill = Arm)) +
  geom_col(position = position_dodge(0.7), width = 0.6) +
  geom_text(aes(label = paste0(SVR35, "%")), position = position_dodge(0.7),
            vjust = -0.4, fontface = "bold", size = 3.8) +
  geom_label(data = context_data,
             aes(x = Trial, y = (Combo + Control) / 2, label = paste0("Δ ", round(Delta, 1), "%")),
             inherit.aes = FALSE, fill = "white", size = 3.2, label.size = 0.3, color = pal$red) +
  scale_fill_manual(values = c("Treatment" = pal$sel, "Control" = pal$pbo)) +
  scale_y_continuous(limits = c(0, 78), labels = function(x) paste0(x, "%")) +
  labs(title = "SVR35 Treatment Effect in Context",
       subtitle = "The magnitude of Δ depends heavily on control arm performance",
       x = NULL, y = "SVR35 at Week 24 (%)", fill = NULL) +
  theme_minimal(base_size = 12) +
  theme(legend.position = "top", plot.title = element_text(face = "bold"),
        panel.grid.major.x = element_blank())
```
## Q3–Q5: TSS Failure — Interpretation and Implications
### Why Was There No Symptom Improvement?
The Abs-TSS failure (−9.89 vs. −10.86; p = 0.82) is the most important negative finding in SENTRY. Several factors explain it:
- **Both arms improved substantially.** A \~10-point TSS reduction from a baseline of \~22 points represents a clinically meaningful \~45% reduction in symptom burden. Ruxolitinib is an excellent symptom-controlling agent through JAK-STAT-mediated cytokine suppression
- **Biological ceiling for symptom improvement.** Adding XPO1 inhibition on top of ruxolitinib does not further reduce the inflammatory cytokine milieu that drives constitutional symptoms. The mechanism of selinexor (nuclear export inhibition → c-myc reduction, p53 retention, IκBα-mediated NF-κB suppression) acts on different pathways than those directly responsible for MF symptoms
- **Fatigue exclusion worked in selinexor's favor — and it still failed.** The MFSAF v4.0 excluded fatigue from the TSS, which should have helped selinexor given that fatigue is a known AE. Despite this, no separation was seen
- **Relatively modest baseline symptom burden.** Median TSS of \~20–22/60 left limited room for differential improvement
### TSS as an Endpoint Across MF Trials
```{r tss-across-trials}
#| label: tss-across-trials
tss_trials <- tibble(
  Trial = c("COMFORT-I", "MANIFEST-2", "TRANSFORM-1", "SENTRY"),
  Combination = c("Ruxolitinib", "Pelabresib + Rux", "Navitoclax + Rux", "Selinexor + Rux"),
  `TSS Endpoint` = c("TSS50 at Wk 24", "TSS50 at Wk 24", "TSS50 at Wk 24", "Abs-TSS at Wk 24"),
  `Treatment Arm` = c("45.9%", "52.3%", "~49%", "−9.89 pts"),
  `Control Arm` = c("5.3% (placebo)", "46.3%", "~37%", "−10.86 pts"),
  `P-value` = c("<0.001", "0.055 (NS)", "NS", "0.82 (NS)"),
  `Met Endpoint?` = c("Yes", "No", "No", "No")
)

tss_trials |>
  gt() |>
  tab_header(title = md("**TSS Endpoints Across Frontline MF Phase 3 Trials**"),
             subtitle = "A pattern of failure when adding to ruxolitinib backbone") |>
  tab_style(style = cell_fill(color = "#d5f5e3"),
            locations = cells_body(columns = `Met Endpoint?`, rows = `Met Endpoint?` == "Yes")) |>
  tab_style(style = cell_fill(color = "#fadbd8"),
            locations = cells_body(columns = `Met Endpoint?`, rows = `Met Endpoint?` == "No")) |>
  my_gt_theme()
```
::: callout-warning
## A Pattern, Not An Anomaly
**Three consecutive Phase 3 frontline MF combination trials (MANIFEST-2, TRANSFORM-1, SENTRY) have all failed to meet TSS endpoints when added to ruxolitinib.** This is no longer a trial-specific finding — it reflects a fundamental biological reality that ruxolitinib saturates symptom control and additional mechanisms cannot reliably improve upon it. Future trial designs need to account for this.
:::
### Did I Expect Symptom Improvement?
No. Given the mechanism of action and the precedent from MANIFEST-2 and TRANSFORM-1, there was no strong biological rationale to expect selinexor would augment symptom control beyond what ruxolitinib provides. The XPO1 inhibition mechanism primarily targets clonal suppression (c-myc, p53) and NF-κB modulation — these are more relevant to spleen reduction and disease modification than to patient-reported symptoms, which are predominantly cytokine-driven and already well-controlled by JAK inhibition.
## Q6–Q8: SVR35 as an Endpoint and Disease Modification
### Does SVR35 Improvement Predict TSS Improvement?
**No — and SENTRY definitively proves this dissociation.** The 49.8% SVR35 rate with essentially zero TSS improvement demonstrates that spleen volume reduction and symptom burden are partially independent clinical dimensions in MF. This has important implications:
- Spleen reduction reflects **mechanical/organ-level response** (reduction in extramedullary hematopoiesis and clonal proliferation)
- Symptoms reflect **systemic inflammatory burden** (cytokine-mediated)
- A drug can improve one without the other
- Both should be evaluated, but expecting them to always co-travel is biologically incorrect
### What Endpoints Would Capture Disease Modification?
Current standard endpoints (SVR35, TSS) were designed for JAK inhibitor development and primarily capture **symptomatic/palliative benefit**. True disease modification requires different measures:
```{r disease-mod-endpoints}
#| label: disease-mod-endpoints
dm_endpoints <- tibble(
  Endpoint = c(
    "Variant allele frequency (VAF) reduction",
    "Bone marrow fibrosis grade improvement",
    "Overall survival",
    "Leukemia-free survival / transformation rate",
    "Cytogenetic / karyotype response",
    "Hemoglobin stabilization / transfusion independence",
    "Durability of response (DOR)",
    "Driver mutation clearance (MRD)"
  ),
  `What It Measures` = c(
    "Clonal burden reduction in JAK2/CALR/MPL",
    "Reversal of marrow fibrotic remodeling",
    "Ultimate clinical benefit",
    "Prevention of disease progression",
    "Resolution of adverse cytogenetics",
    "Restoration of effective hematopoiesis",
    "Sustained biological control vs. transient palliation",
    "Deep molecular response / potential cure"
  ),
  `Current Status` = c(
    "Exploratory in most trials; SENTRY showed 32% vs 24%",
    "Exploratory; data pending for SENTRY",
    "Secondary in SENTRY; HR 0.43 (nominal)",
    "SENTRY: 1.7% in both arms (no difference)",
    "Rarely assessed in MF trials",
    "Secondary in SENTRY; data pending",
    "Not yet reported for SENTRY",
    "Not routinely assessed; technically challenging"
  ),
  `Strength of Evidence` = c(
    "Moderate — correlates with outcomes in IFN studies",
    "Strong — predicts OS in some studies",
    "Gold standard but requires long follow-up",
    "Important but rare events need large N",
    "Limited data in MF",
    "Moderate — relevant for anemia-predominant MF",
    "High — distinguishes disease mod from palliation",
    "Very early; not yet validated in MF"
  )
)

dm_endpoints |>
  gt() |>
  tab_header(title = md("**Endpoints for Disease Modification in Myelofibrosis**"),
             subtitle = "Beyond SVR35 and TSS") |>
  cols_width(Endpoint ~ px(180), `What It Measures` ~ px(200),
             `Current Status` ~ px(200), `Strength of Evidence` ~ px(200)) |>
  my_gt_theme()
```
### How Should Future MF Trials Be Designed?
The failure of TSS across multiple trials demands a rethinking of MF trial design:
- **Co-primary endpoints should be reconsidered.** Pairing SVR35 with TSS when both are expected to fail on TSS creates an unnecessary hurdle. Consider SVR35 as the sole primary with TSS as a key secondary
- **Disease modification endpoints should be elevated.** VAF reduction, fibrosis improvement, and OS should be pre-specified as powered secondary endpoints, not exploratory
- **Composite endpoints** (e.g., SVR35 + hemoglobin improvement + VAF reduction) may better capture multi-dimensional benefit
- **Longer primary assessment windows** (Week 48 instead of Week 24) would better capture disease-modifying effects
- **Biomarker-enriched designs** (e.g., stratifying by mutation type, VAF burden, or cytogenetic risk) could identify patients most likely to benefit from specific combinations
## Q9–Q11: Overall Survival Signal
### Thoughts on the OS Signal
```{r os-forest}
#| label: os-forest
#| fig-cap: "Overall Survival — SENTRY vs. Historical MF Trial OS Data"
#| fig-height: 4
os_compare <- tibble(
  Trial = c("COMFORT-I (Rux vs Pbo, 51 wk)", "SENTRY (Sel+Rux vs Rux, 12 mo)"),
  HR = c(0.50, 0.43),
  Lower = c(0.25, 0.19),
  Upper = c(0.98, 1.00),
  Events = c("~28 vs ~27", "11 vs 12"),
  P = c("0.04", "0.022 (nominal)")
)

ggplot(os_compare, aes(y = Trial, x = HR)) +
  geom_point(size = 4, color = pal$sel) +
  geom_errorbarh(aes(xmin = Lower, xmax = Upper), height = 0.2, linewidth = 1, color = pal$sel) +
  geom_vline(xintercept = 1, linetype = "dashed", color = "grey40") +
  scale_x_continuous(limits = c(0, 1.5), breaks = seq(0, 1.5, 0.25)) +
  labs(title = "Overall Survival Hazard Ratios — Frontline MF Trials",
       subtitle = "Both signals are early and require maturation",
       x = "Hazard Ratio (95% CI)", y = NULL) +
  theme_minimal(base_size = 12) +
  theme(plot.title = element_text(face = "bold"))
```
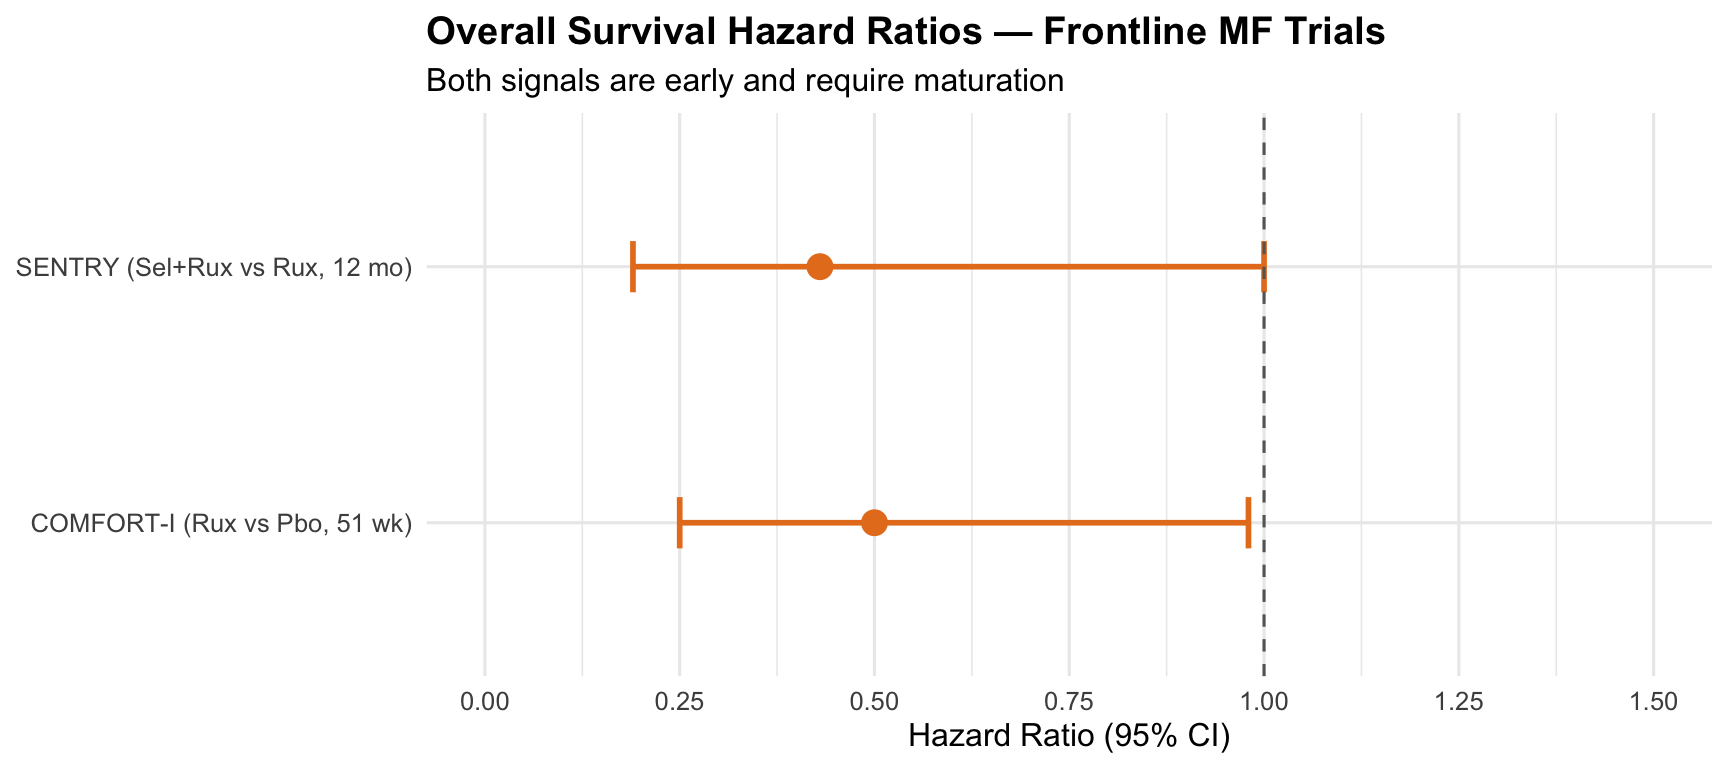
The OS signal (HR 0.43, 95% CI 0.19–1.00, nominal p = 0.0222) is **intriguing but must be interpreted with extreme caution**:
- **Only 23 total deaths** (11 vs. 12) with median follow-up of \~12 months — far too few events for definitive conclusions
- **The 95% CI touches 1.00** — the signal is on the boundary of statistical significance
- **This is a secondary endpoint with a nominal p-value** — not adjusted for multiplicity
- However, the **magnitude (\>50% risk reduction)** and **biological plausibility** (spleen response predicting OS, per Coltro et al. data cited by Karyopharm) make this worth pursuing
- **Post-hoc landmark analyses** suggesting SVR35 may predict OS add mechanistic support
### What Data Do We Need as OS Matures?
- **Longer follow-up** (≥24 months) with more events to narrow the confidence interval
- **Kaplan-Meier curves** — we have not seen these yet; the shape of separation matters enormously
- **OS by SVR35 response status** — does achieving SVR35 predict OS within each arm?
- **OS by DIPSS risk category** — is the benefit concentrated in higher-risk patients?
- **Cause of death data** — to distinguish MF-related mortality from competing causes
- **Post-study therapy details** — did control arm patients have access to effective salvage?
- **Patient retention data** — the investigator call emphasized keeping patients on study for follow-up even after treatment discontinuation, which is critical for reliable OS assessment
### Will FDA Weigh the OS Signal?
The FDA will view the OS data as **supportive but not sufficient** for the following reasons:
- It is a secondary endpoint and therefore not part of the formal hypothesis testing hierarchy
- The event count is too low and the CI is too wide
- However, in the context of a disease where OS is the ultimate endpoint and where no frontline combination has demonstrated OS benefit, the FDA may give this signal meaningful weight in their benefit-risk assessment
- The FDA has historically accepted SVR35 alone for MF approval (COMFORT-I), and the SENTRY OS data strengthens the argument that SVR35 improvement translates to clinical benefit
- **If OS data mature to a more convincing level by the time of the sNDA submission**, it could become the pivotal supporting data point for approval
## Q12–Q13: VAF Reduction and Disease Modification
```{r vaf-comparison}
#| label: vaf-comparison
#| fig-cap: "VAF Reduction (≥20%) at Week 24 — SENTRY Exploratory Endpoint"
#| fig-height: 3.5
vaf_plot <- tibble(
  Arm = c("Selinexor +\nRuxolitinib\n(n=169)", "Placebo +\nRuxolitinib\n(n=92)"),
  Pct = c(32, 24)
)

ggplot(vaf_plot, aes(x = Arm, y = Pct, fill = Arm)) +
  geom_col(width = 0.55) +
  geom_text(aes(label = paste0(Pct, "%")), vjust = -0.5, fontface = "bold", size = 5) +
  scale_fill_manual(values = c(pal$sel, pal$pbo)) +
  scale_y_continuous(limits = c(0, 42), labels = function(x) paste0(x, "%")) +
  labs(title = "≥20% VAF Reduction in Driver Mutations (JAK2 / CALR / MPL)",
       subtitle = "Pre-specified exploratory endpoint — Week 24",
       x = NULL, y = "Proportion (%)") +
  theme_minimal(base_size = 13) +
  theme(legend.position = "none", plot.title = element_text(face = "bold"),
        panel.grid.major.x = element_blank())
```
### Does This Look Like Disease Modification?
**Not convincingly — but the signal is in the right direction.** Here is my framework:
- The 8 percentage-point difference (32% vs. 24%) is **modest and exploratory** — no formal statistical testing was presented
- **Ruxolitinib itself achieves VAF reduction in some patients**, so the 24% in the control arm is expected. The incremental benefit of selinexor is small
- True disease modification requires evidence of:
- **Sustained and deepening** VAF reduction over time (not just a snapshot at Week 24)
- **Correlation between VAF reduction and clinical outcomes** (OS, PFS, transfusion independence)
- **Bone marrow fibrosis improvement** — this is the most direct histological evidence and we do not yet have it from SENTRY
- **Normalization of hematopoiesis** — improvement in blood counts, reduction in blasts
- For comparison, **interferon-alpha** achieves molecular responses (including complete molecular remission) in a subset of MPN patients, and **INCA033989** in mutCALR ET shows 44% achieving ≥20% VAF reduction with selective depletion of mutant stem cells — these are more convincing disease modification signals
- The XPO1 mechanism (p53 nuclear retention → apoptosis, c-myc suppression → reduced clonal proliferation) provides biological plausibility for clonal suppression, but the Phase 3 data show only a modest incremental effect
**What disease modification looks like to me:**
- ≥50% VAF reduction in a meaningful proportion of patients (\>20–25%)
- Bone marrow fibrosis grade improvement (MF-3 → MF-2 or lower)
- Sustained and durable responses that deepen over time
- Correlation between molecular/histological responses and OS/PFS
## Q14–Q15: Safety Data and Nausea
### Safety Assessment
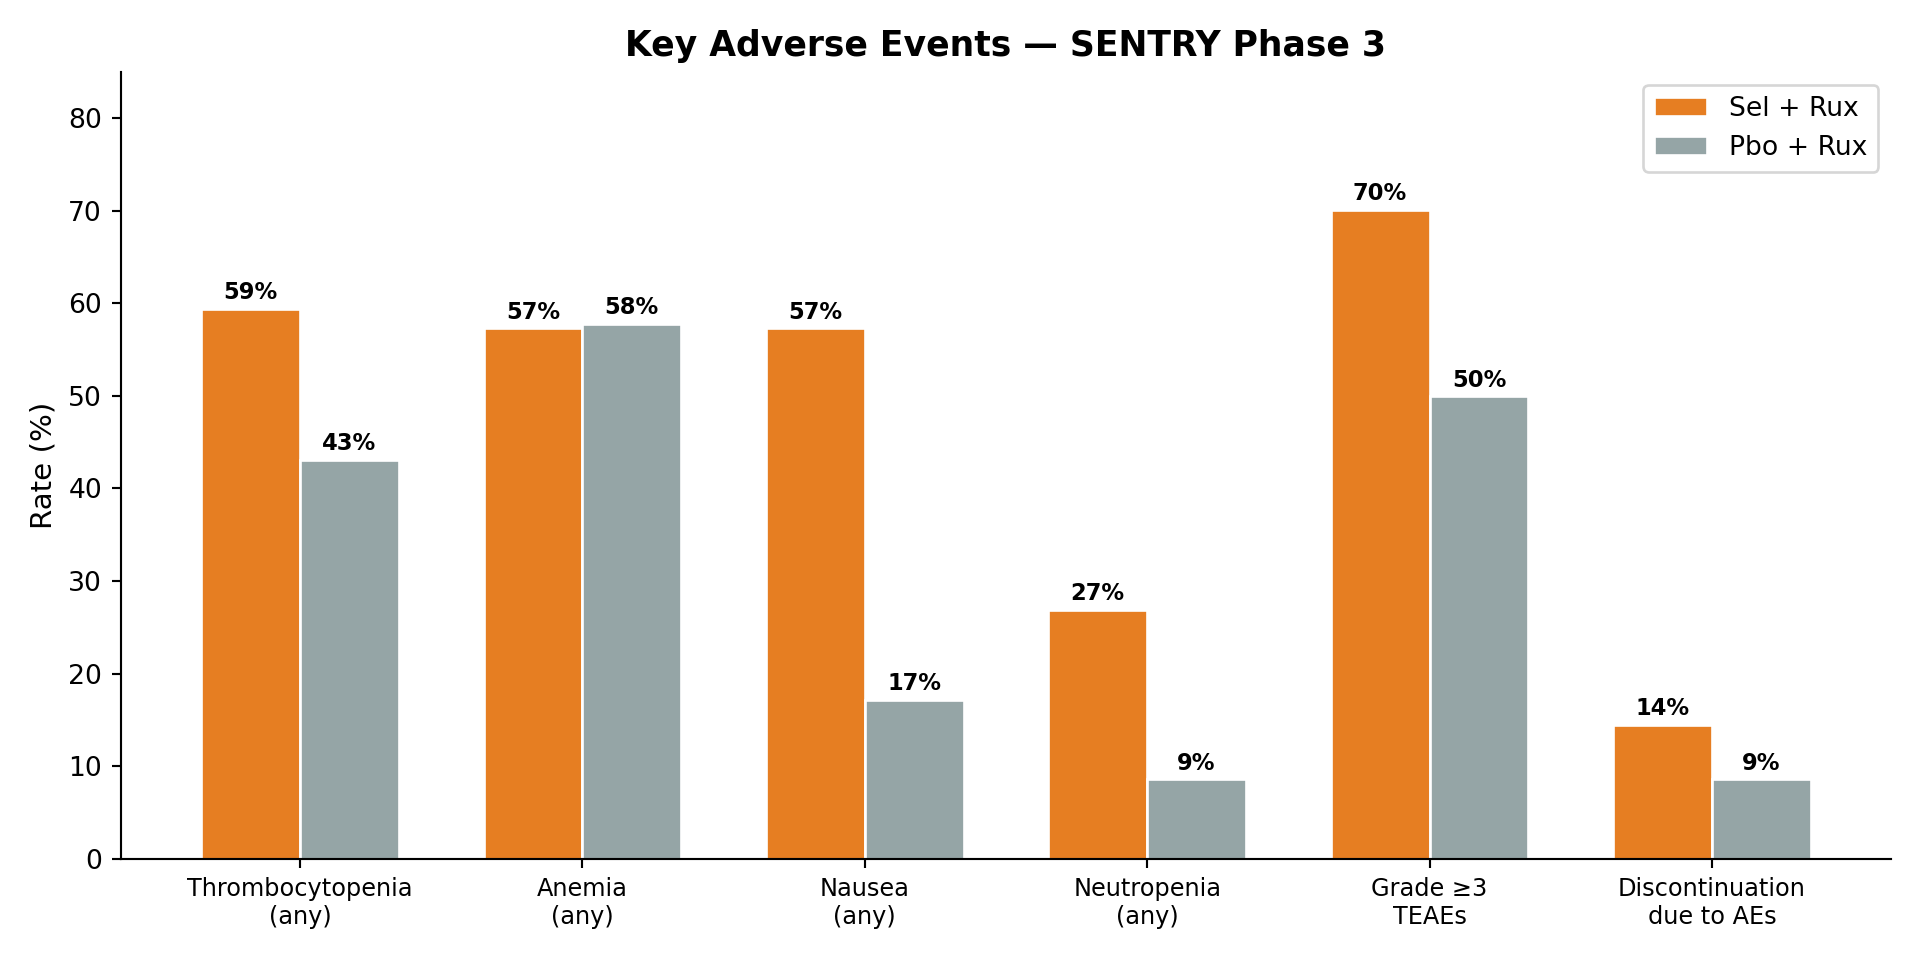
The safety profile is **consistent with expectations but adds meaningful burden:**
- **No new safety signals** — this is reassuring and confirms the known profiles of both drugs
- **Grade ≥3 TEAEs: 70.1% vs. 50.0%** — a 20 percentage-point absolute increase is clinically significant
- **Thrombocytopenia (59% vs. 43%)** and **neutropenia (27% vs. 9%)** are expected given the overlapping myelosuppressive effects
- **Anemia was equivalent (57% vs. 58%)** — notably, selinexor did not worsen anemia
- **Leukemic transformation was identical (1.7% both arms)** — important for the disease modification narrative; XPO1 inhibition is not accelerating transformation
- **Discontinuation rate of 14.5% vs. 8.6%** — a \~6% absolute increase, which is manageable but not trivial
### Nausea Assessment
**57.3% any-grade nausea is significant but manageable with proactive antiemetics:**
- This is lower than the 79% seen in the Phase 1 (likely due to better prophylaxis in Phase 3)
- Selinexor-associated nausea is **well-characterized** from the myeloma experience (XPOVIO approval)
- Effective management requires **pre-treatment with 5-HT3 antagonists (ondansetron) ± NK1 receptor antagonists**
- The fact that TSS (which excluded fatigue) showed no worsening suggests nausea was **manageable enough not to detrimentally impact overall symptom burden** — Dr. Rampal specifically noted this during the investigator call
- **Acceptable level of nausea:** In MF patients, where the disease carries significant morbidity and 4–5 year median survival in intermediate/high-risk disease, Grade 1–2 nausea that is prophylactically manageable is acceptable if accompanied by meaningful clinical benefit (SVR35 improvement, potential OS benefit). Grade 3 nausea rates will be important when the full safety data are published
```{python safety-comparison}
#| label: safety-comparison
#| fig-cap: "Safety Profile Comparison — Key Adverse Events"
import matplotlib.pyplot as plt
import numpy as np

categories = ['Thrombocytopenia\n(any)', 'Anemia\n(any)', 'Nausea\n(any)',
              'Neutropenia\n(any)', 'Grade ≥3\nTEAEs', 'Discontinuation\ndue to AEs']
sel_rux  = [59.4, 57.3, 57.3, 26.9, 70.1, 14.5]
pbo_rux  = [43.1, 57.8, 17.2, 8.6, 50.0, 8.6]

fig, ax = plt.subplots(figsize=(10, 5))
x = np.arange(len(categories))
w = 0.35
bars1 = ax.bar(x - w/2, sel_rux, w, label='Sel + Rux', color='#e67e22', edgecolor='white')
bars2 = ax.bar(x + w/2, pbo_rux, w, label='Pbo + Rux', color='#95a5a6', edgecolor='white')
for b in bars1:
    ax.text(b.get_x()+b.get_width()/2, b.get_height()+1, f'{b.get_height():.0f}%',
            ha='center', fontsize=8.5, fontweight='bold')
for b in bars2:
    ax.text(b.get_x()+b.get_width()/2, b.get_height()+1, f'{b.get_height():.0f}%',
            ha='center', fontsize=8.5, fontweight='bold')
ax.set_xticks(x); ax.set_xticklabels(categories, fontsize=9)
ax.set_ylabel('Rate (%)', fontsize=11); ax.set_ylim(0, 85)
ax.legend(fontsize=10); ax.set_title('Key Adverse Events — SENTRY Phase 3', fontsize=13, fontweight='bold')
ax.spines['top'].set_visible(False); ax.spines['right'].set_visible(False)
plt.tight_layout(); plt.show()
```
## Q16–Q18: Regulatory Path and NCCN Guidelines
### Likelihood of FDA Approval
```{r approval-scorecard}
#| label: approval-scorecard
scorecard <- tibble(
  Factor = c("Co-primary SVR35 met", "Co-primary TSS missed",
             "OS signal (secondary, nominal)", "VAF reduction (exploratory)",
             "Safety / tolerability", "Unmet medical need",
             "Existing approval (selinexor in MM)", "Regulatory precedent (SVR35 alone)",
             "Going concern risk for Karyopharm"),
  `Supports Approval` = c("Strong", "Negative", "Supportive", "Supportive",
                          "Neutral/Negative", "Strong", "Supportive", "Mixed", "Negative"),
  Assessment = c(
    "✓ Robust, statistically significant, clinically meaningful",
    "✗ No trend toward improvement; worse than MANIFEST-2 miss",
    "~ HR 0.43 promising but immature (23 events); CI touches 1.00",
    "~ Modest difference (32% vs 24%); exploratory only",
    "⚠ 70% Gr≥3; 57% nausea; 14.5% discontinuation; 20% more Gr3+ vs ctrl",
    "✓ Only JAKi class approved; genuine unmet need for combinations",
    "✓ Known safety profile; sNDA pathway feasible",
    "~ COMFORT-I approved on SVR35 vs placebo; harder vs active control",
    "⚠ 10-K filing noted substantial doubt about ability to continue as going concern"
  )
)

scorecard |>
  gt() |>
  tab_header(title = md("**Regulatory Approval Scorecard**")) |>
  tab_style(style = cell_fill(color = "#d5f5e3"),
            locations = cells_body(columns = `Supports Approval`,
                                   rows = `Supports Approval` == "Strong")) |>
  tab_style(style = cell_fill(color = "#fadbd8"),
            locations = cells_body(columns = `Supports Approval`,
                                   rows = `Supports Approval` == "Negative")) |>
  tab_style(style = cell_fill(color = "#fdebd0"),
            locations = cells_body(columns = `Supports Approval`,
                                   rows = `Supports Approval` %in% c("Supportive", "Mixed", "Neutral/Negative"))) |>
  cols_width(Factor ~ px(200), `Supports Approval` ~ px(120), Assessment ~ px(400)) |>
  my_gt_theme()
```
**Estimated probability of approval: 40–55%**
Key factors:
- **What FDA has historically needed in MF:** SVR35 has been the primary endpoint for all JAK inhibitor approvals (ruxolitinib, fedratinib, pacritinib, momelotinib). Ruxolitinib was approved on SVR35 vs. placebo. However, the bar has risen — subsequent approvals (fedratinib, pacritinib, momelotinib) all showed SVR + TSS or addressed specific unmet needs (cytopenias)
- **How not hitting Abs-TSS affects approval:** It significantly weakens the application. The FDA will ask: "If patients don't feel better, what is the clinical benefit of spleen reduction alone?" The OS signal partially addresses this but is immature
- **The totality-of-data argument:** Karyopharm will present SVR35 (met) + OS signal (supportive) + VAF reduction (supportive) + known safety profile + unmet need. This may be sufficient, particularly if OS data mature
- **Precedent note:** If pelabresib receives approval (also missed TSS at p=0.055), it establishes a precedent that SVR35 alone can support combination approval in frontline MF
### Potential Label
If approved:
- **Indication:** Selinexor in combination with ruxolitinib for intermediate- or high-risk MF in adults not previously treated with JAK inhibitors, with platelets ≥100 × 10⁹/L
- **Dose:** 60 mg orally once weekly + ruxolitinib per prescribing information
- **Clinical studies section:** Will prominently note TSS co-primary was not met
- **Warnings:** Strong language on cytopenias, GI toxicity, monitoring requirements
### NCCN Guidelines
**Likelihood of NCCN listing: Moderate (50–60%)**, even before formal FDA approval:
- Karyopharm has projected potential compendia inclusion in H2 2026
- NCCN may list selinexor + ruxolitinib as a Category 2A recommendation under "Higher-Risk MF, PLT ≥50×10⁹/L" as an option for JAKi-naïve patients, potentially with a note about the TSS failure
- Compendia listing could enable off-label reimbursement even before formal approval
- The current NCCN v1.2026 guidelines already list "JAKi combination" as an option under the anemia management section
## Q19–Q22: Uptake, Clinical Positioning, and Impact on Current Practice
### Who Are the Relevant Patients?
```{r patient-selection}
#| label: patient-selection
patients <- tibble(
  `Patient Profile` = c(
    "Int-2/High-risk MF with massive splenomegaly (≥1800 cm³)",
    "Pre-transplant patients needing rapid spleen reduction",
    "Patients failing to achieve SVR35 on rux monotherapy by Wk 12",
    "Patients with PLT ≥100 tolerating rux well but inadequate spleen response",
    "Patients whose primary complaint is symptoms (fatigue, night sweats)",
    "Patients with PLT 50–100 × 10⁹/L",
    "Patients with significant GI comorbidities",
    "Elderly patients with limited performance status"
  ),
  `Would I Use Sel+Rux?` = c(
    "Yes — primary population; spleen reduction is the dominant goal",
    "Yes — rapid Week 12 response (49% SVR35) is attractive for bridging",
    "Consider — early switch/addition if rux alone is insufficient",
    "Consider — augmenting spleen response with acceptable safety",
    "No — no TSS benefit; rux monotherapy is sufficient for symptoms",
    "No — below eligibility threshold; use pacritinib or momelotinib",
    "Caution — 57% nausea rate may be prohibitive",
    "Caution — 70% Gr≥3 TEAEs; risk-benefit less favorable"
  ),
  Priority = c("High", "High", "Moderate", "Moderate", "Low", "Ineligible", "Low", "Low")
)

patients |>
  gt() |>
  tab_header(title = md("**Patient Selection Framework — Selinexor + Ruxolitinib**")) |>
  tab_style(style = cell_fill(color = "#d5f5e3"),
            locations = cells_body(columns = Priority, rows = Priority == "High")) |>
  tab_style(style = cell_fill(color = "#fdebd0"),
            locations = cells_body(columns = Priority, rows = Priority == "Moderate")) |>
  tab_style(style = cell_fill(color = "#fadbd8"),
            locations = cells_body(columns = Priority, rows = Priority %in% c("Low", "Ineligible"))) |>
  cols_width(`Patient Profile` ~ px(300), `Would I Use Sel+Rux?` ~ px(320), Priority ~ px(90)) |>
  my_gt_theme()
```
### Impact on Current JAKi Use
**How this affects my use of ruxolitinib monotherapy, pacritinib, momelotinib, and fedratinib:**
- **Ruxolitinib monotherapy:** Remains my frontline standard for most patients. Sel+Rux would be considered specifically for patients where spleen reduction is the primary goal, not for symptom-predominant disease. Rux monotherapy is simpler, better tolerated, and achieves equivalent symptom control
- **Pacritinib:** Unaffected. Pacritinib occupies a distinct niche (PLT \<50×10⁹/L) that does not overlap with SENTRY eligibility (PLT ≥100). These are different patient populations
- **Momelotinib:** Unaffected for anemia-predominant MF. Momelotinib's unique value is transfusion independence and hemoglobin improvement, which selinexor does not address
- **Fedratinib:** Minimal impact. Fedratinib is primarily used in the second-line (post-ruxolitinib) setting. In the frontline setting where fedratinib competes with ruxolitinib, the SENTRY data do not change fedratinib's positioning
### Uptake Projections
```{r uptake-timeline}
#| label: uptake-timeline
#| fig-cap: "Projected Uptake Curve — If Approved"
#| fig-height: 4
uptake_curve <- tibble(
  Quarter = c("Q1", "Q2", "Q3", "Q4", "Q5", "Q6", "Q7", "Q8",
              "Q9", "Q10", "Q11", "Q12"),
  Year = c(rep("Year 1", 4), rep("Year 2", 4), rep("Year 3", 4)),
  Pct_of_eligible = c(3, 5, 8, 12, 15, 18, 22, 25, 28, 30, 32, 35),
  Setting = "Frontline MF (PLT ≥100, Int-2/High)"
) |> mutate(Quarter_num = row_number())

ggplot(uptake_curve, aes(x = Quarter_num, y = Pct_of_eligible)) +
  geom_line(color = pal$sel, linewidth = 1.5) +
  geom_point(color = pal$sel, size = 3) +
  geom_area(alpha = 0.15, fill = pal$sel) +
  geom_hline(yintercept = 25, linetype = "dashed", color = "grey50") +
  annotate("text", x = 3, y = 27, label = "Realistic peak: ~25–35%",
           fontsize = 3.5, color = "grey40") +
  scale_x_continuous(breaks = c(1, 4, 8, 12),
                     labels = c("Launch", "Year 1", "Year 2", "Year 3")) +
  scale_y_continuous(limits = c(0, 40), labels = function(x) paste0(x, "%")) +
  labs(title = "Projected Uptake — Selinexor + Ruxolitinib in Frontline MF",
       subtitle = "Among eligible patients (Int-2/High, PLT ≥100, spleen-predominant)",
       x = NULL, y = "% of Eligible Patients") +
  theme_minimal(base_size = 12) +
  theme(plot.title = element_text(face = "bold"))
```
### How Quickly Would I Start Using This?
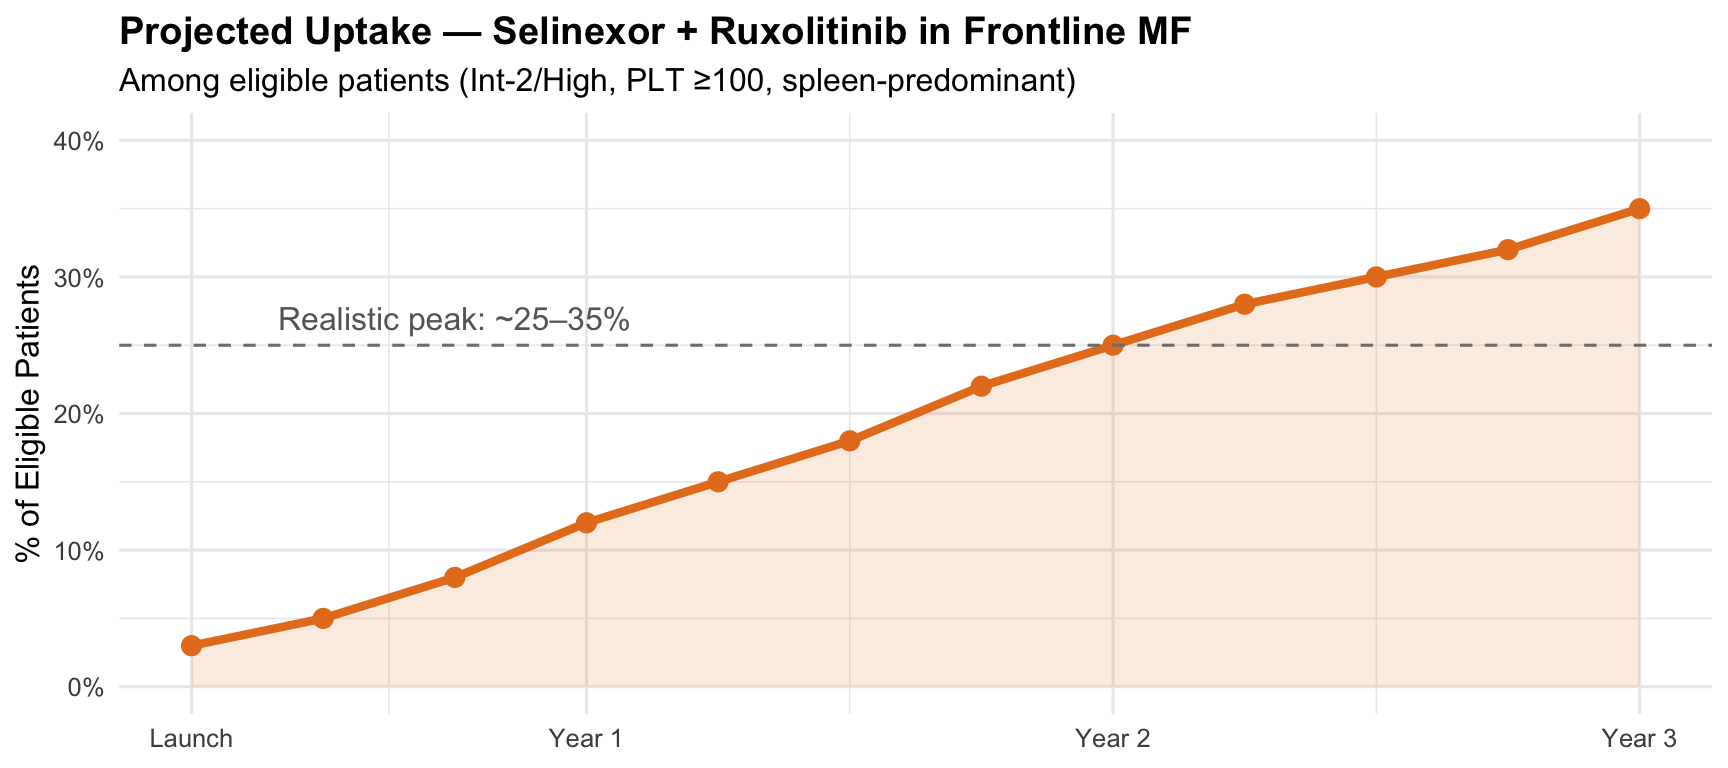
**Slow adoption, academic-center-led:**
- **Immediately upon approval/compendia listing:** I would use this for select patients where spleen reduction is the dominant clinical priority — specifically:
- Patients with massive splenomegaly causing mechanical symptoms, portal hypertension, or who need rapid spleen reduction prior to transplant
- This would represent approximately **10–15% of my new frontline MF starts**
- **Within 6–12 months:** As I gain comfort with nausea management and see real-world durability data, I might expand to **15–25% of eligible patients**
- **At peak (Year 2–3):** If OS data mature favorably and compendia/guidelines are updated, potentially **25–35% of eligible frontline patients** with spleen-predominant disease
**Factors that would accelerate adoption:**
- Confirmation of the OS signal with longer follow-up
- Publication of bone marrow fibrosis improvement data
- Real-world evidence of effective nausea prophylaxis protocols
- NCCN Category 1 or 2A recommendation
**Factors that would limit adoption:**
- Persistent OS immaturity at the time of publication
- Pelabresib approval with stronger SVR35 data (66% vs 50%)
- Emergence of new combinations with better multi-dimensional profiles
- Community oncologist reluctance due to nausea burden and complexity
## Additional Observations
### Phase 1 to Phase 3 Attrition
```{r ph1-to-ph3}
#| label: ph1-to-ph3
bench_score <- tibble(
  Endpoint = c("SVR35 (Week 24)", "TSS50 (Week 24)", "Abs-TSS Change",
               "Grade ≥3 Anemia", "Discontinuation Rate", "OS Signal"),
  `Phase 1 (n=14)` = c("79%", "58%", "−18.5 pts", "43%", "TBD", "N/A"),
  `Phase 3 (n=353)` = c("49.8%", "Not reported", "−9.89 pts",
                         "57.3% any grade", "14.5%", "HR 0.43"),
  `Attrition` = c("−29 pts (major)", "Endpoint failed", "−8.6 pts (major)",
                   "Worse", "At threshold", "Exceeded expectations")
)

bench_score |>
  gt() |>
  tab_header(title = md("**Phase 1 → Phase 3 Attrition**"),
             subtitle = "A cautionary tale about extrapolating from n=14") |>
  tab_style(style = cell_fill(color = "#fadbd8"),
            locations = cells_body(columns = Attrition,
                                   rows = Attrition %in% c("−29 pts (major)", "Endpoint failed",
                                                            "−8.6 pts (major)", "Worse"))) |>
  tab_style(style = cell_fill(color = "#d5f5e3"),
            locations = cells_body(columns = Attrition,
                                   rows = Attrition %in% c("At threshold", "Exceeded expectations"))) |>
  my_gt_theme()
```
### Emerging Pipeline Context
```{r pipeline}
#| label: pipeline
pipeline <- tibble(
  Agent = c("Selinexor + Rux", "Pelabresib + Rux", "INCA033989 (mutCALR Ab)",
            "Navtemadlin (MDM2i)", "Imetelstat", "Elritercept (TAK-226)"),
  Mechanism = c("XPO1i + JAKi", "BETi + JAKi", "Anti-mutCALR mAb",
                "MDM2 inhibitor", "Telomerase inhibitor", "Activin trap"),
  Setting = c("1L (JAKi-naïve)", "1L (JAKi-naïve)", "mutCALR ET/MF",
              "2L+ MF", "2L+ MF (approved)", "MF anemia"),
  `Key Result` = c("SVR35 50% (met); TSS (NS); OS HR 0.43",
                    "SVR35 66% (met); TSS (NS, p=0.055)",
                    "80% ORR (ET); 90% VAF↓; Ph1", "Phase 3 ongoing",
                    "Approved; OS benefit in 2L", "Phase 2; anemia improvement"),
  `Disease Mod.` = c("Modest (VAF Δ 8%)", "Fibrosis improvement",
                      "Strong (selective clone depletion)", "Expected (p53)",
                      "Yes (telomere suppression)", "Limited")
)

pipeline |>
  gt() |>
  tab_header(title = md("**MF Pipeline — Contextualizing SENTRY**")) |>
  tab_style(style = cell_fill(color = "#fdebd0"), locations = cells_body(rows = 1)) |>
  cols_width(Agent ~ px(150), `Key Result` ~ px(230)) |>
  my_gt_theme()
```
# Summary
```{r summary}
#| label: summary
conclusions <- tibble(
  Domain = c("Spleen Response", "Symptom Control", "Overall Survival",
             "Disease Modification", "Safety", "Regulatory Path",
             "Clinical Positioning", "Competitive Standing"),
  Assessment = c(
    "Strong — near-doubling of SVR35, rapid onset (Wk 12), sustained through Wk 36",
    "No benefit — identical TSS improvement; consistent with MANIFEST-2/TRANSFORM-1 pattern",
    "Promising but immature — HR 0.43 with only 23 events; needs ≥24-month follow-up",
    "Early signal — modest VAF difference (32% vs 24%); BM fibrosis data pending",
    "Manageable but burdensome — 70% Gr≥3, 57% nausea, 14.5% discontinuation",
    "Uncertain (40–55%) — met 1 of 2 co-primaries; sNDA engagement is next step",
    "Niche: spleen-predominant, transplant-bridge, PLT ≥100 patients",
    "Below pelabresib on SVR35; potentially differentiated on OS if confirmed"
  ),
  `Bottom Line` = c(
    "✓ Practice-relevant for spleen-focused management",
    "✗ Does not support adding selinexor for symptom control",
    "~ Could become THE key differentiator if confirmed",
    "~ Hypothesis-generating; far from proven",
    "⚠ Requires proactive antiemetic protocols and monitoring",
    "~ OS maturation is the single most important variable",
    "~ Slow academic-led adoption; 10–25% of eligible patients initially",
    "~ Second-choice combo unless OS advantage emerges"
  )
)

conclusions |>
  gt() |>
  tab_header(title = md("**SENTRY Phase 3 — Final Assessment**")) |>
  tab_style(style = cell_fill(color = "#d5f5e3"),
            locations = cells_body(rows = Domain == "Spleen Response")) |>
  tab_style(style = cell_fill(color = "#fadbd8"),
            locations = cells_body(rows = Domain == "Symptom Control")) |>
  tab_style(style = cell_fill(color = "#fdebd0"),
            locations = cells_body(rows = !Domain %in% c("Spleen Response", "Symptom Control"))) |>
  cols_width(Domain ~ px(150), Assessment ~ px(350), `Bottom Line` ~ px(280)) |>
  my_gt_theme()
```
::: callout-note
## Final Perspective
SENTRY represents a **meaningful but incomplete advance** in frontline MF. The spleen response is robust and practice-relevant. The absence of symptom improvement limits broad applicability. The OS signal is the most intriguing finding — if confirmed with maturation, it could fundamentally reposition this combination. Until then, selinexor + ruxolitinib will occupy a niche role for spleen-predominant disease at academic MPN centers.
**The most important thing to watch for:** OS data maturation over the next 12–18 months. This single variable will determine whether SENTRY is remembered as a marginally positive trial or a paradigm-shifting one.
:::
# References
1. Verstovsek S, et al. *N Engl J Med* 2012;366:799-807.
2. Rampal RK, et al. *Nat Med* 2025;31:1531-1538.
3. Mascarenhas J, et al. *J Clin Oncol* 2023;41:4993-5004.
4. Coltro G, et al. *Cancer Medicine* 2023.
5. Karyopharm Therapeutics. Phase 3 SENTRY Topline Results. March 24, 2026.
6. Yan D, et al. *Clin Cancer Res* 2019;25(7):2323-2335.
7. Ross DM, et al. *Blood* 2024.
8. Passamonti F, et al. *Blood* 2010;115(9):1703-1708.
9. NCCN Clinical Practice Guidelines v1.2026. Myeloproliferative Neoplasms.
------------------------------------------------------------------------
*Document generated: `r Sys.Date()` \| Analysis based on topline data; conclusions may evolve with full publication.*