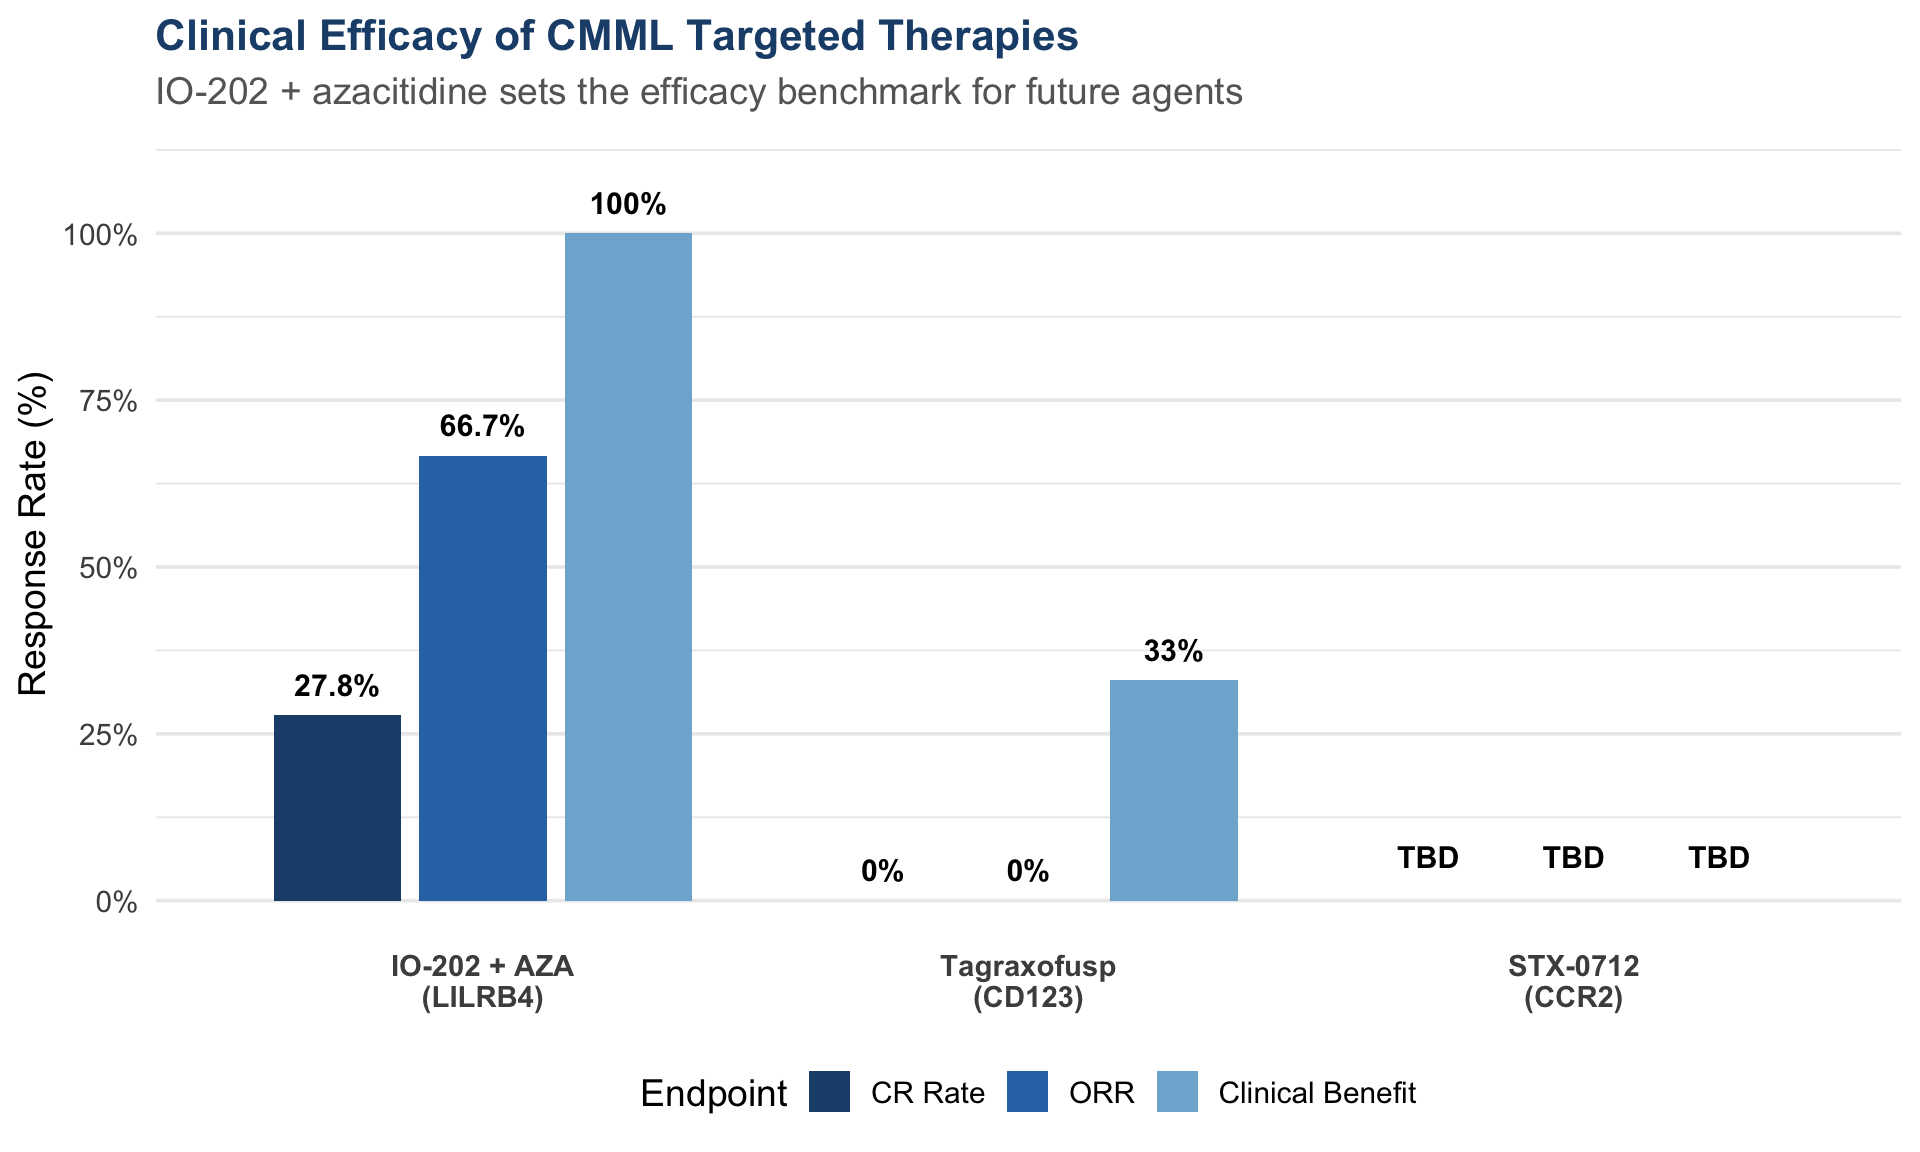
efficacy_visual <- tibble(
  Agent = rep(c("IO-202 + AZA\n(LILRB4)", "Tagraxofusp\n(CD123)", "STX-0712\n(CCR2)"), 3),
  Metric = rep(c("CR Rate", "ORR", "Clinical Benefit"), each = 3),
  Value = c(27.8, 0, NA, 66.7, 0, NA, 100, 33, NA),
  Label = c("27.8%", "0%", "TBD", "66.7%", "0%", "TBD", "100%", "33%", "TBD")
)

efficacy_visual$Agent <- factor(efficacy_visual$Agent,
                                 levels = c("IO-202 + AZA\n(LILRB4)",
                                           "Tagraxofusp\n(CD123)",
                                           "STX-0712\n(CCR2)"))
efficacy_visual$Metric <- factor(efficacy_visual$Metric,
                                  levels = c("CR Rate", "ORR", "Clinical Benefit"))

ggplot(efficacy_visual, aes(x = Agent, y = Value, fill = Metric)) +
  geom_col(position = position_dodge(width = 0.8), width = 0.7, na.rm = TRUE) +
  geom_text(aes(label = Label, y = ifelse(is.na(Value), 5, Value + 3)),
            position = position_dodge(width = 0.8),
            fontface = "bold", size = 4, vjust = 0) +
  scale_fill_manual(values = c("CR Rate" = "#1F4E79",
                               "ORR" = "#2E75B6",
                               "Clinical Benefit" = "#7FB3D5")) +
  scale_y_continuous(limits = c(0, 110), breaks = seq(0, 100, 25),
                     labels = function(x) paste0(x, "%")) +
  labs(title = "Clinical Efficacy of CMML Targeted Therapies",
       subtitle = "IO-202 + azacitidine sets the efficacy benchmark for future agents",
       x = NULL, y = "Response Rate (%)", fill = "Endpoint") +
  theme_minimal(base_size = 14) +
  theme(
    plot.title = element_text(face = "bold", color = "#1F4E79", size = 16),
    plot.subtitle = element_text(color = "#666666"),
    legend.position = "bottom",
    panel.grid.major.x = element_blank(),
    axis.text.x = element_text(face = "bold", size = 11)
  )