2  First-line treatment options

2.1 First-Line Treatment Options

2.1.1 Standard Immunosuppressive Therapy

Code
# First-line treatment options
first_line <- tibble(
  Drug = c("Cyclophosphamide", "Methotrexate", "Cyclosporine A"),
  Dosing = c(
    "100 mg/day (max 1 year)",
    "10 mg/m²/week",
    "3 mg/kg/day"
  ),
  `Response Rate (M4)` = c("73%", "32%", "~50-70%*"),
  `Complete Response (M4)` = c("24%", "12%", "Variable"),
  `Preferred Scenarios` = c(
    "Anemia, PRCA; First-line option",
    "Concurrent rheumatoid arthritis",
    "Overlapping aplastic anemia; After CP/MTX failure"
  ),
  Duration = c(
    "Max 12 months (mutagenic risk)",
    "Until progression",
    "Until progression"
  )
)

first_line %>%
  kable(
    caption = "First-Line Treatment Options for LGL Leukemia",
    booktabs = TRUE
  ) %>%
  kable_styling(
    bootstrap_options = c("striped", "hover"),
    full_width = FALSE,
    font_size = 11
  ) %>%
  column_spec(5, width = "15em") %>%
  add_footnote(
    "*Based on retrospective data; M4 = Month 4 assessment",
    notation = "alphabet"
  )
First-Line Treatment Options for LGL Leukemia
Drug Dosing Response Rate (M4) Complete Response (M4) Preferred Scenarios Duration
Cyclophosphamide 100 mg/day (max 1 year) 73% 24% Anemia, PRCA; First-line option Max 12 months (mutagenic risk)
Methotrexate 10 mg/m²/week 32% 12% Concurrent rheumatoid arthritis Until progression
Cyclosporine A 3 mg/kg/day ~50-70%* Variable Overlapping aplastic anemia; After CP/MTX failure Until progression
a *Based on retrospective data; M4 = Month 4 assessment

2.1.2 French Prospective Trial Results (2024)

The largest prospective randomized trial comparing cyclophosphamide to methotrexate:

Code
# Data from the French trial (Lamy et al., Blood 2024)
trial_data <- tibble(
  Outcome = c(
    "Patients Evaluable (M4)",
    "Complete Response Rate",
    "Overall Response Rate",
    "Response in STAT3-mutated",
    "Response in STAT3 wild-type",
    "Relapse Rate",
    "Second-line Switch Efficacy"
  ),
  Cyclophosphamide = c(
    "74",
    "24% (18/74)",
    "73% (54/74)",
    "61% (mutated)",
    "32% (wild-type)",
    "18% at M12",
    "64% after MTX failure"
  ),
  Methotrexate = c(
    "76",
    "12% (9/76)",
    "32% (24/76)",
    "Data combined",
    "Data combined",
    "25% at M12",
    "33% after CP failure"
  ),
  `p-value` = c(
    "N/A",
    "0.047",
    "<0.001",
    "N/A",
    "N/A",
    "NS",
    "N/A"
  )
)

trial_data %>%
  kable(
    caption = "French Prospective Trial: Cyclophosphamide vs Methotrexate (NCT01976182)",
    booktabs = TRUE
  ) %>%
  kable_styling(
    bootstrap_options = c("striped", "hover"),
    full_width = FALSE
  ) %>%
  row_spec(2:3, background = "#e6f3ff")
French Prospective Trial: Cyclophosphamide vs Methotrexate (NCT01976182)
Outcome Cyclophosphamide Methotrexate p-value
Patients Evaluable (M4) 74 76 N/A
Complete Response Rate 24% (18/74) 12% (9/76) 0.047
Overall Response Rate 73% (54/74) 32% (24/76) <0.001
Response in STAT3-mutated 61% (mutated) Data combined N/A
Response in STAT3 wild-type 32% (wild-type) Data combined N/A
Relapse Rate 18% at M12 25% at M12 NS
Second-line Switch Efficacy 64% after MTX failure 33% after CP failure N/A
Code
# Visualize trial results
response_data <- tibble(
  Treatment = rep(c("Cyclophosphamide", "Methotrexate"), each = 3),
  Response = rep(c("Complete Response", "Partial Response", "No Response"), 2),
  Percentage = c(24, 49, 27, 12, 20, 68)
)

response_data$Response <- factor(
  response_data$Response,
  levels = c("No Response", "Partial Response", "Complete Response")
)

ggplot(response_data, aes(x = Treatment, y = Percentage, fill = Response)) +
  geom_bar(stat = "identity", position = "stack", alpha = 0.85) +
  geom_text(
    aes(label = paste0(Percentage, "%")),
    position = position_stack(vjust = 0.5),
    color = "white",
    fontface = "bold",
    size = 4
  ) +
  labs(
    title = "First-Line Treatment Response Rates at 4 Months",
    subtitle = "French Prospective Randomized Trial (N=150 evaluable patients)",
    x = "Treatment Arm",
    y = "Percentage of Patients (%)",
    fill = "Response Category",
    caption = "Source: Lamy et al., Blood 2024 (ASH Abstract)"
  ) +
  theme_minimal() +
  theme(
    plot.title = element_text(face = "bold", size = 14),
    legend.position = "bottom"
  ) +
  scale_fill_manual(
    values = c(
      "No Response" = "#d32f2f",
      "Partial Response" = "#ffa726",
      "Complete Response" = "#66bb6a"
    )
  ) +
  coord_flip()
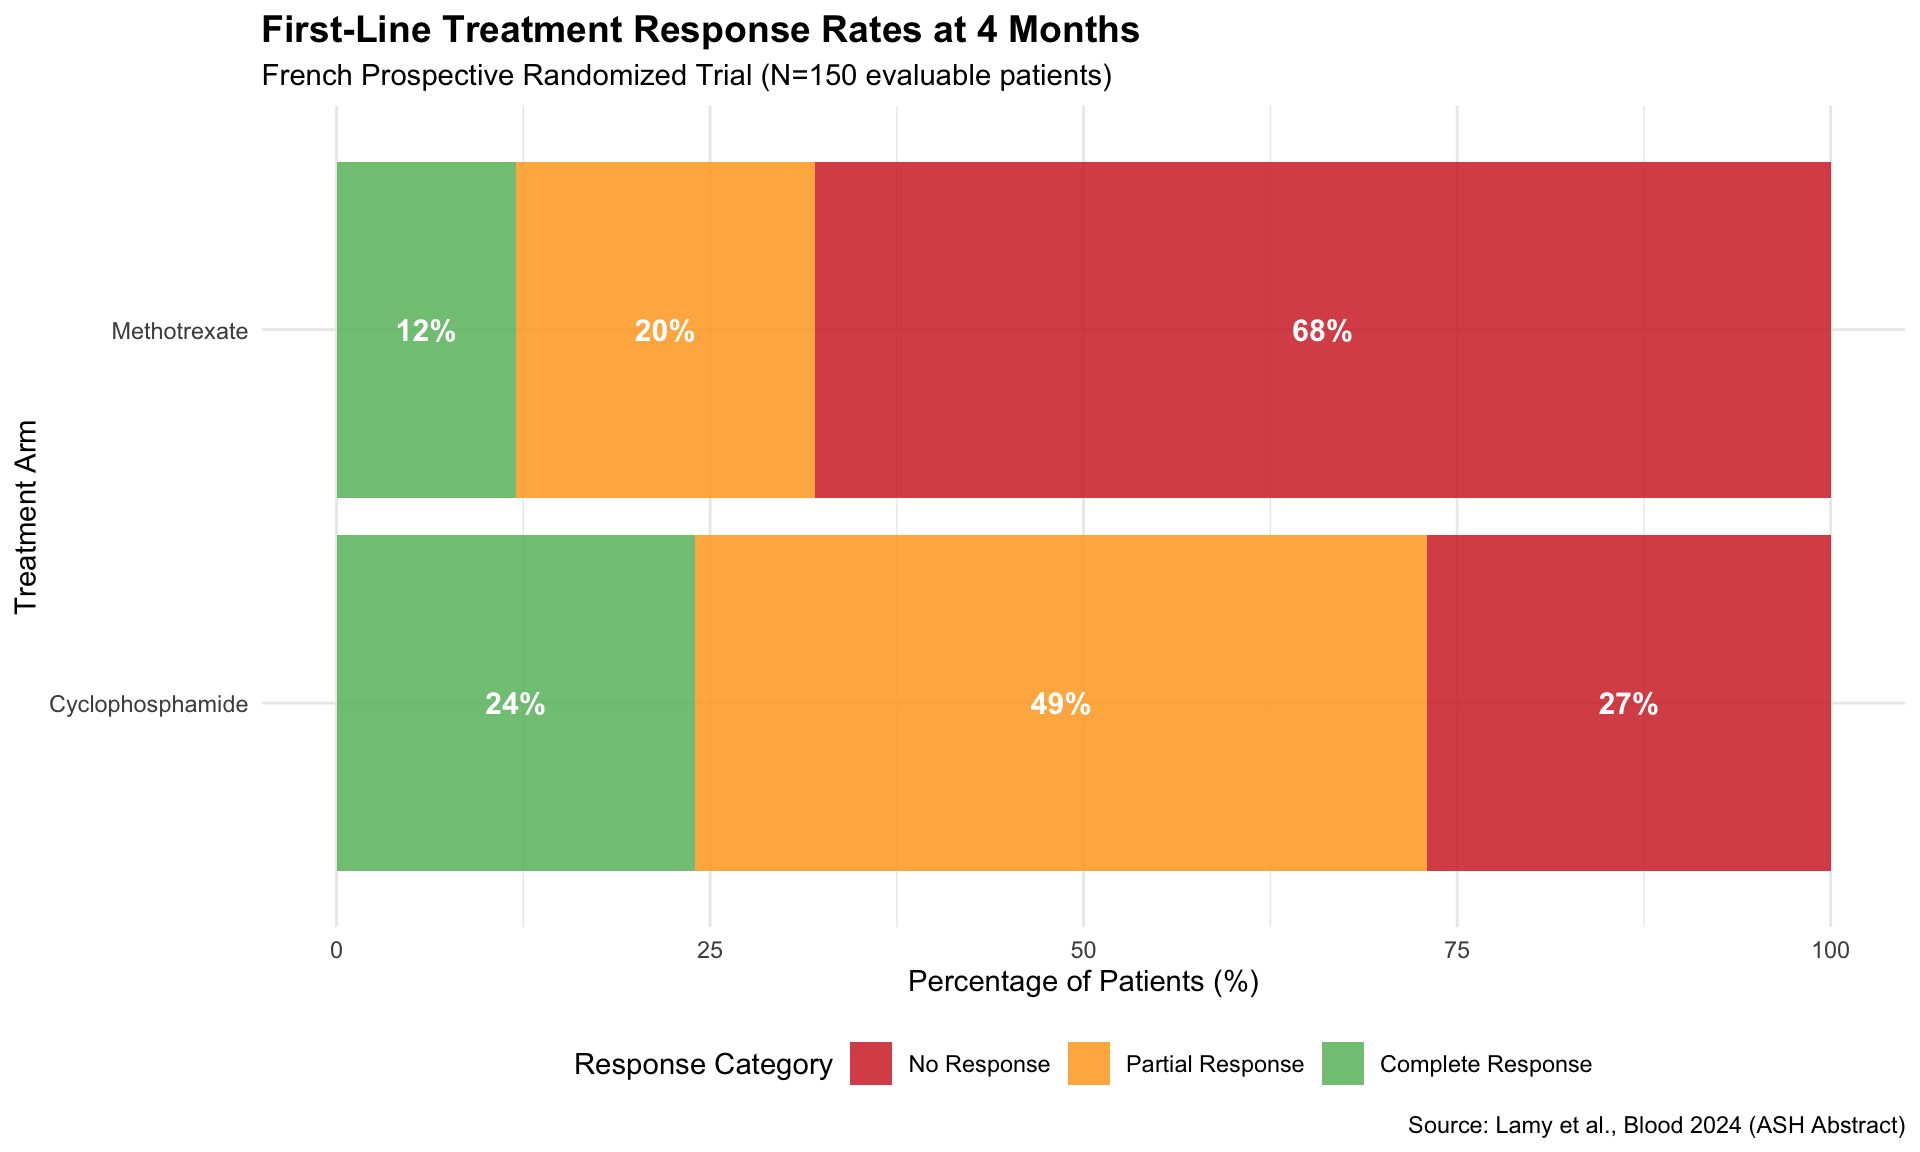
Comparison of First-Line Treatment Responses at 4 Months

Trial Conclusions:

  • Cyclophosphamide shows significantly superior efficacy to methotrexate
  • No difference in toxicity or secondary malignancies between arms
  • Cyclophosphamide or methotrexate recommended as first-line options
  • Cyclosporine typically reserved for specific scenarios or after first-line failure