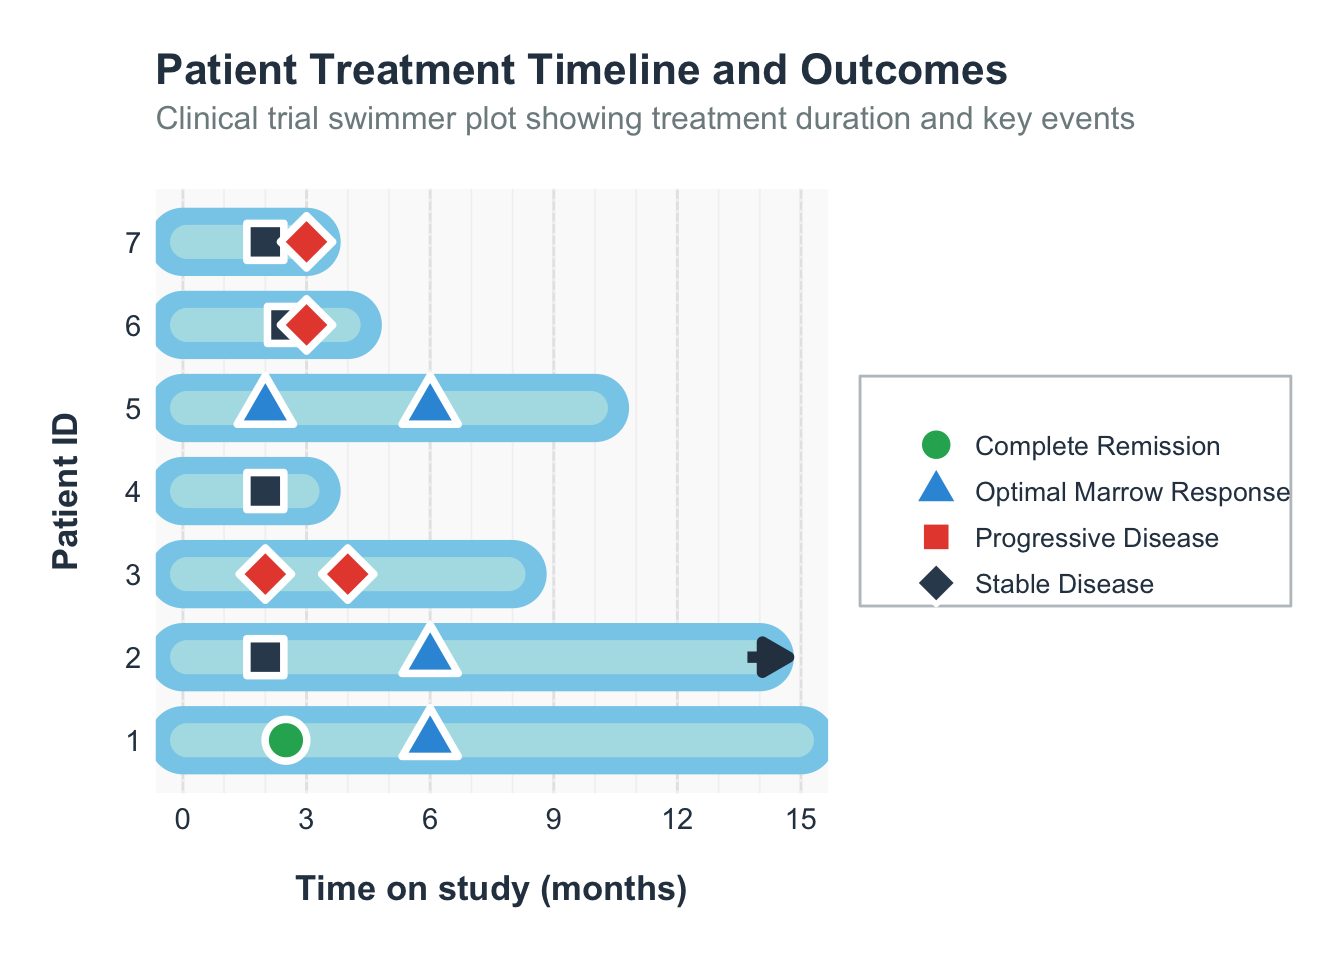
# Create sample data that matches your graph
patient_data <- data.frame(
  patient_id = 1:7,
  start_time = rep(0, 7),
  end_time = c(15, 14, 8, 3, 10, 4, 3),
  ongoing = c(FALSE, TRUE, FALSE, FALSE, FALSE, FALSE, FALSE)
)

# Create events data
events_data <- data.frame(
  patient_id = c(1, 1, 2, 2, 3, 3, 4, 5, 5, 6, 6, 7, 7),
  time = c(2.5, 6, 2, 6, 2, 4, 2, 2, 6, 2.5, 3, 2, 3),
  event_type = c("Complete Remission", "Optimal Marrow Response",
                 "Stable Disease", "Optimal Marrow Response",
                 "Progressive Disease", "Progressive Disease",
                 "Stable Disease",
                 "Optimal Marrow Response", "Optimal Marrow Response",
                 "Stable Disease", "Progressive Disease",
                 "Stable Disease", "Progressive Disease")
)

# Create the enhanced swimmer plot
p <- ggplot() +
  # Add subtle background grid
  geom_vline(xintercept = seq(0, 15, 3), color = "gray95", size = 0.5, linetype = "dotted") +

  # Add patient timelines as rounded horizontal bars with gradient effect
  geom_segment(data = patient_data,
               aes(x = start_time, xend = end_time,
                   y = patient_id, yend = patient_id),
               color = "#87CEEB", size = 12, lineend = "round") +

  # Add subtle inner line for depth
  geom_segment(data = patient_data,
               aes(x = start_time + 0.1, xend = end_time - 0.1,
                   y = patient_id, yend = patient_id),
               color = "#B0E0E6", size = 6, lineend = "round") +

  # Add events as points with enhanced styling
  geom_point(data = events_data,
             aes(x = time, y = patient_id,
                 shape = event_type, fill = event_type),
             color = "white", size = 6, stroke = 2) +

  # Add arrow for ongoing treatment with enhanced styling
  geom_segment(data = filter(patient_data, ongoing == TRUE),
               aes(x = end_time - 0.3, xend = end_time + 0.7,
                   y = patient_id, yend = patient_id),
               arrow = arrow(length = unit(0.4, "cm"), type = "closed"),
               color = "#2C3E50", size = 2) +

  # Enhanced shapes and colors
  scale_shape_manual(
    name = "",
    values = c("Complete Remission" = 21,      # filled circle
               "Optimal Marrow Response" = 24,  # filled triangle
               "Stable Disease" = 22,           # filled square
               "Progressive Disease" = 23),     # filled diamond
    guide = guide_legend(override.aes = list(size = 5, stroke = 1.5))
  ) +

  scale_fill_manual(
    name = "",
    values = c("Complete Remission" = "#27AE60",     # vibrant green
               "Optimal Marrow Response" = "#3498DB",  # vibrant blue
               "Stable Disease" = "#34495E",           # dark blue-gray
               "Progressive Disease" = "#E74C3C"),     # vibrant red
    guide = guide_legend(override.aes = list(size = 5, stroke = 1.5, shape = c(21, 24, 22, 23)))
  ) +

  # Enhanced axis styling
  scale_x_continuous(
    limits = c(-0.5, 15.5),
    breaks = seq(0, 15, 3),
    minor_breaks = seq(0, 15, 1),
    expand = c(0.01, 0)
  ) +

  scale_y_continuous(
    breaks = 1:7,
    labels = 1:7,
    limits = c(0.5, 7.5),
    expand = c(0.02, 0)
  ) +

  # Professional labels
  labs(
    x = "Time on study (months)",
    y = "Patient ID",
    title = "Patient Treatment Timeline and Outcomes",
    subtitle = "Clinical trial swimmer plot showing treatment duration and key events"
  ) +

  # Enhanced theme
  theme_minimal(base_size = 12) +
  theme(
    # Grid styling
    panel.grid.major.x = element_line(color = "gray90", size = 0.5),
    panel.grid.minor.x = element_line(color = "gray95", size = 0.3),
    panel.grid.major.y = element_blank(),
    panel.grid.minor.y = element_blank(),

    # Background
    panel.background = element_rect(fill = "#FAFAFA", color = NA),
    plot.background = element_rect(fill = "white", color = NA),

    # Text styling
    axis.text = element_text(color = "#2C3E50", size = 11),
    axis.title = element_text(color = "#2C3E50", size = 13, face = "bold"),
    axis.title.x = element_text(margin = margin(t = 15)),
    axis.title.y = element_text(margin = margin(r = 15)),

    # Title styling
    plot.title = element_text(color = "#2C3E50", size = 16, face = "bold",
                             margin = margin(b = 5)),
    plot.subtitle = element_text(color = "#7F8C8D", size = 12,
                                margin = margin(b = 20)),

    # Legend styling
    legend.position = "right",
    legend.background = element_rect(fill = "white", color = "#BDC3C7", size = 0.5),
    legend.margin = margin(l = 20),
    legend.text = element_text(color = "#2C3E50", size = 10),
    legend.key = element_blank(),
    legend.spacing.y = unit(0.3, "cm"),

    # Plot margins
    plot.margin = margin(20, 20, 20, 20),

    # Remove axis ticks
    axis.ticks = element_blank()
  )