# Create summary data for visualization
summary_data <- tibble(
  Agent_Class = factor(c(
    "Menin Inhibitors\n(Revumenib)",
    "Menin Inhibitors\n(Ziftomenib)",
    "Next-Gen Menin\n(Bleximenib)",
    "MLLT1/3 TPD\n(Dark Blue)",
    "CDK9 Inhibitors\n(SLS009)"
  ), levels = c(
    "Menin Inhibitors\n(Revumenib)",
    "Menin Inhibitors\n(Ziftomenib)",
    "Next-Gen Menin\n(Bleximenib)",
    "MLLT1/3 TPD\n(Dark Blue)",
    "CDK9 Inhibitors\n(SLS009)"
  )),
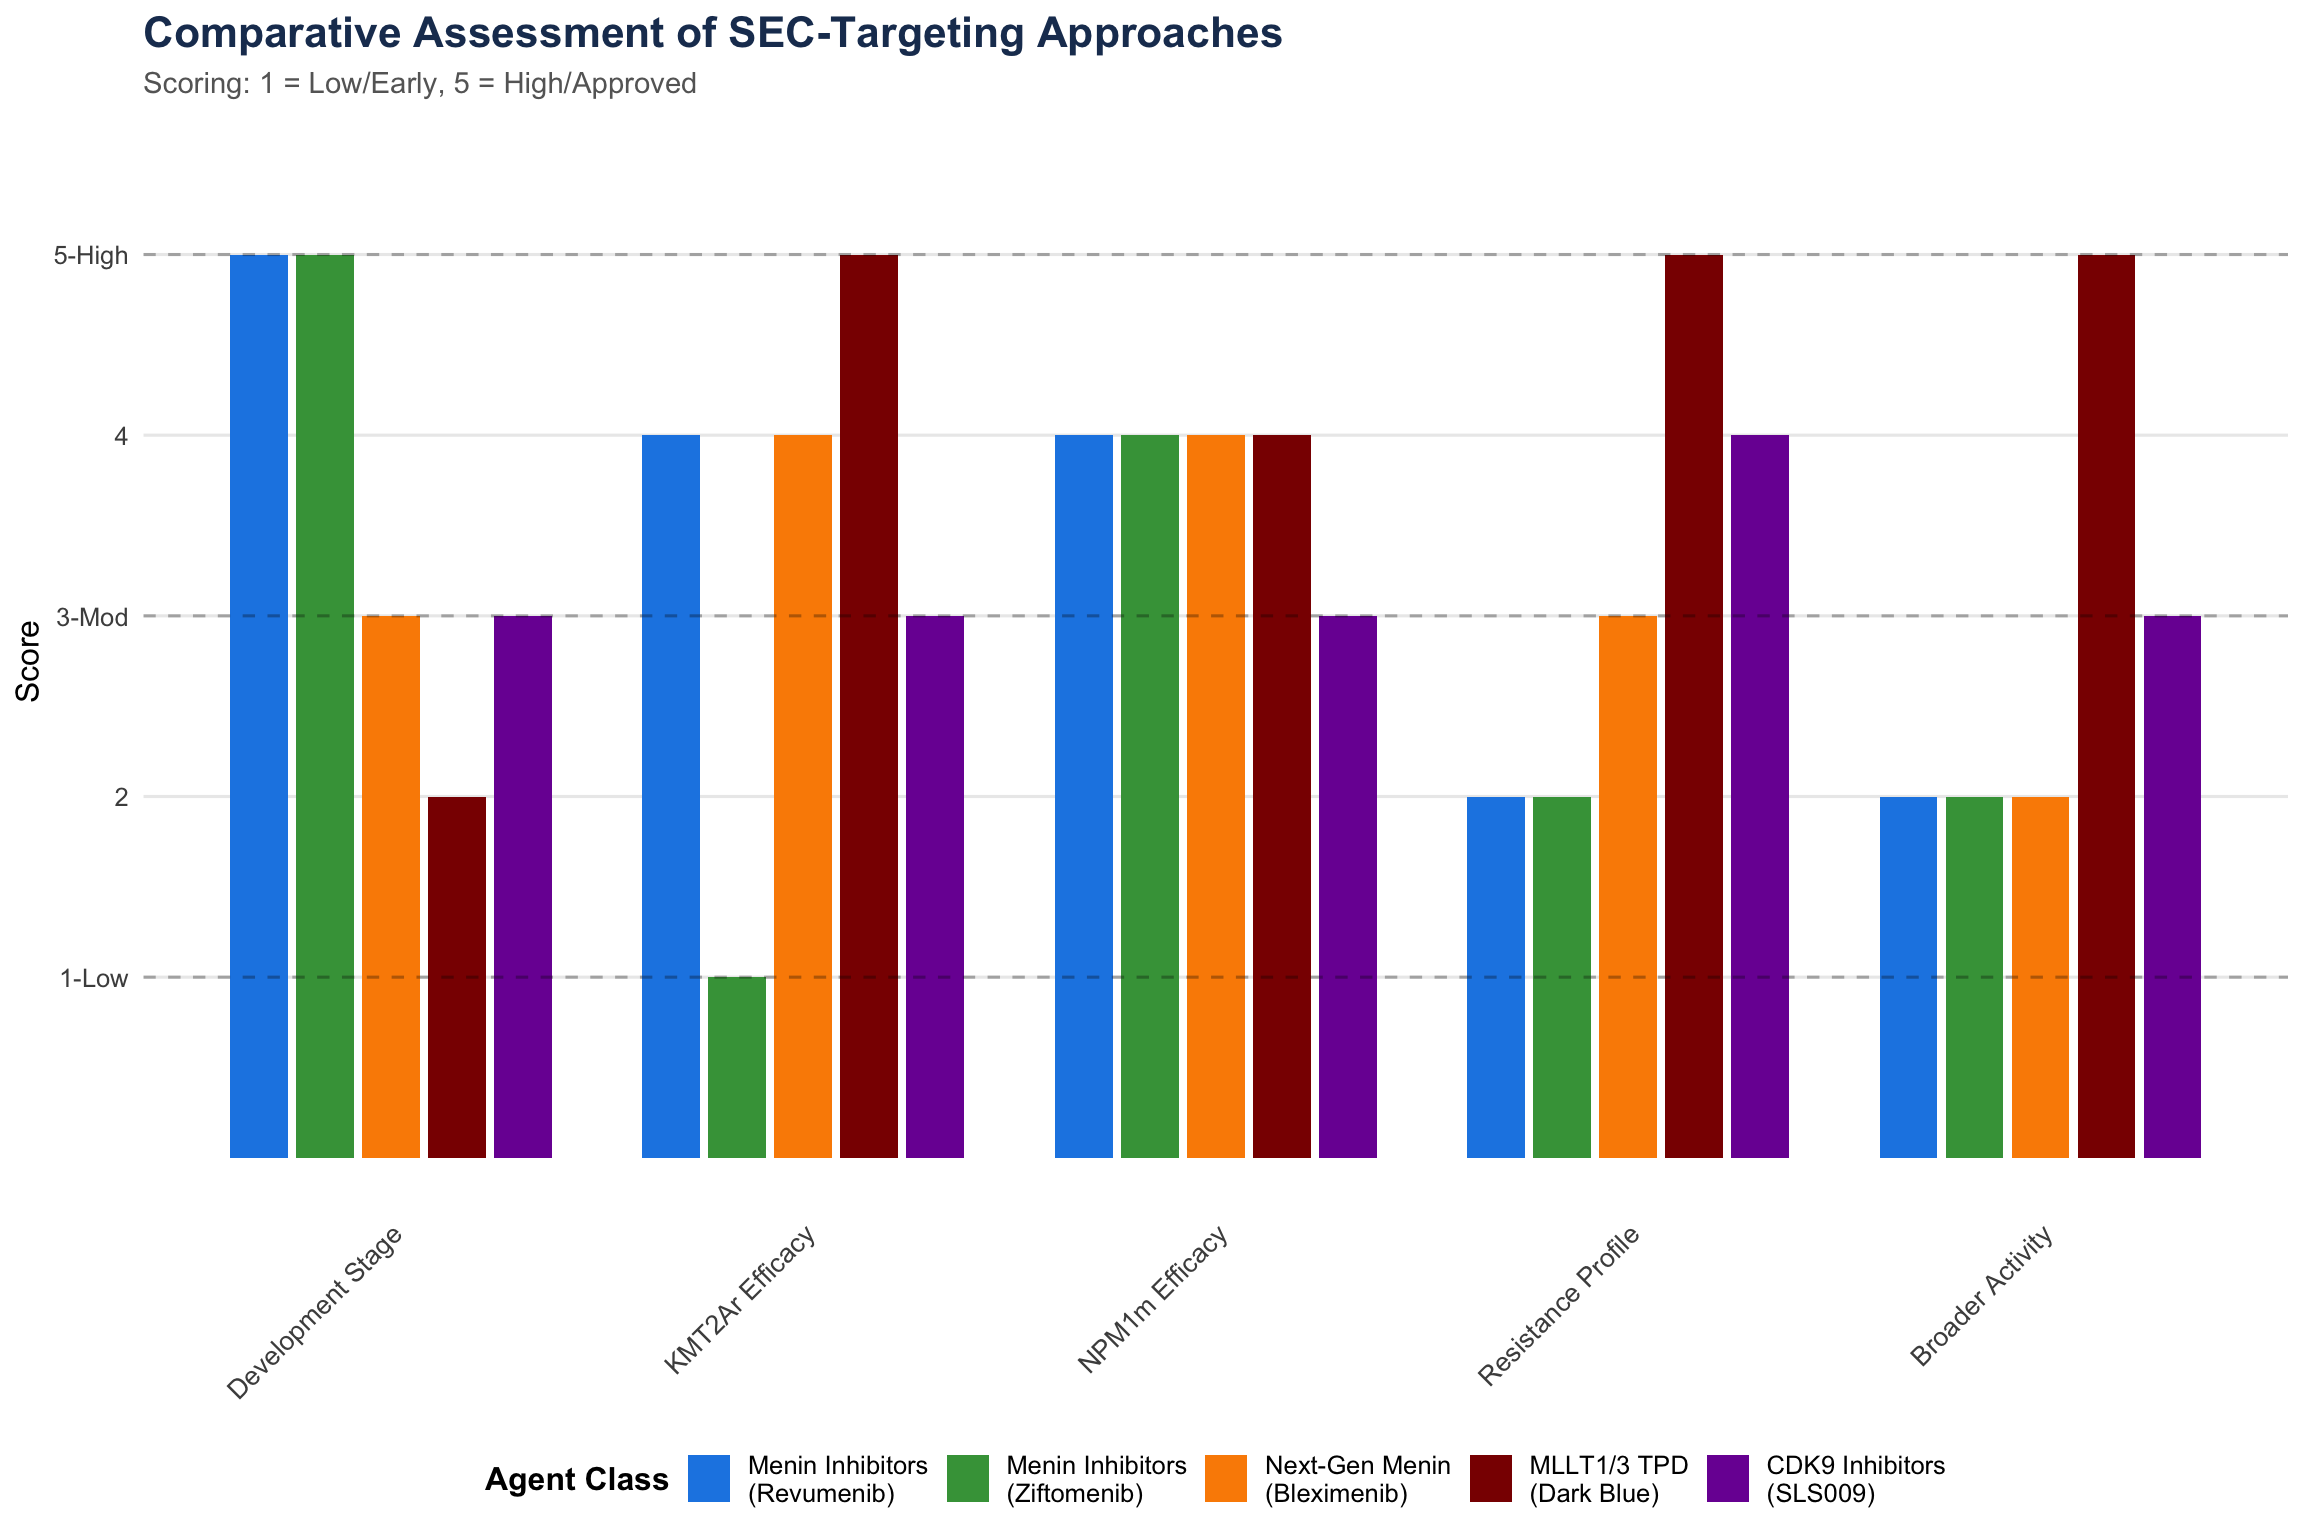
  Development_Stage = c(5, 5, 3, 2, 3),
  Efficacy_KMT2Ar = c(4, 1, 4, 5, 3),
  Efficacy_NPM1m = c(4, 4, 4, 4, 3),
  Resistance_Profile = c(2, 2, 3, 5, 4),
  Broader_Activity = c(2, 2, 2, 5, 3)
)

# Reshape for radar-style bar chart
summary_long <- summary_data %>%
  pivot_longer(
    cols = -Agent_Class,
    names_to = "Metric",
    values_to = "Score"
  ) %>%
  mutate(
    Metric = factor(Metric,
                    levels = c("Development_Stage", "Efficacy_KMT2Ar",
                              "Efficacy_NPM1m", "Resistance_Profile", "Broader_Activity"),
                    labels = c("Development Stage", "KMT2Ar Efficacy",
                              "NPM1m Efficacy", "Resistance Profile", "Broader Activity"))
  )

ggplot(summary_long, aes(x = Metric, y = Score, fill = Agent_Class)) +
  geom_bar(stat = "identity", position = position_dodge(width = 0.8), width = 0.7) +
  scale_fill_manual(values = c(
    "Menin Inhibitors\n(Revumenib)" = "#1E88E5",
    "Menin Inhibitors\n(Ziftomenib)" = "#43A047",
    "Next-Gen Menin\n(Bleximenib)" = "#FB8C00",
    "MLLT1/3 TPD\n(Dark Blue)" = "#8B0000",
    "CDK9 Inhibitors\n(SLS009)" = "#7B1FA2"
  )) +
  scale_y_continuous(breaks = 1:5, labels = c("1-Low", "2", "3-Mod", "4", "5-High"),
                     limits = c(0, 5.5)) +
  labs(
    title = "Comparative Assessment of SEC-Targeting Approaches",
    subtitle = "Scoring: 1 = Low/Early, 5 = High/Approved",
    x = NULL,
    y = "Score",
    fill = "Agent Class"
  ) +
  theme_minimal(base_size = 12) +
  theme(
    plot.title = element_text(face = "bold", size = 16, color = "#1E3A5F"),
    plot.subtitle = element_text(size = 11, color = "#666666"),
    axis.text.x = element_text(angle = 45, hjust = 1, size = 10),
    legend.position = "bottom",
    legend.title = element_text(face = "bold"),
    panel.grid.major.x = element_blank(),
    panel.grid.minor = element_blank()
  ) +
  geom_hline(yintercept = c(1, 3, 5), linetype = "dashed", alpha = 0.3)